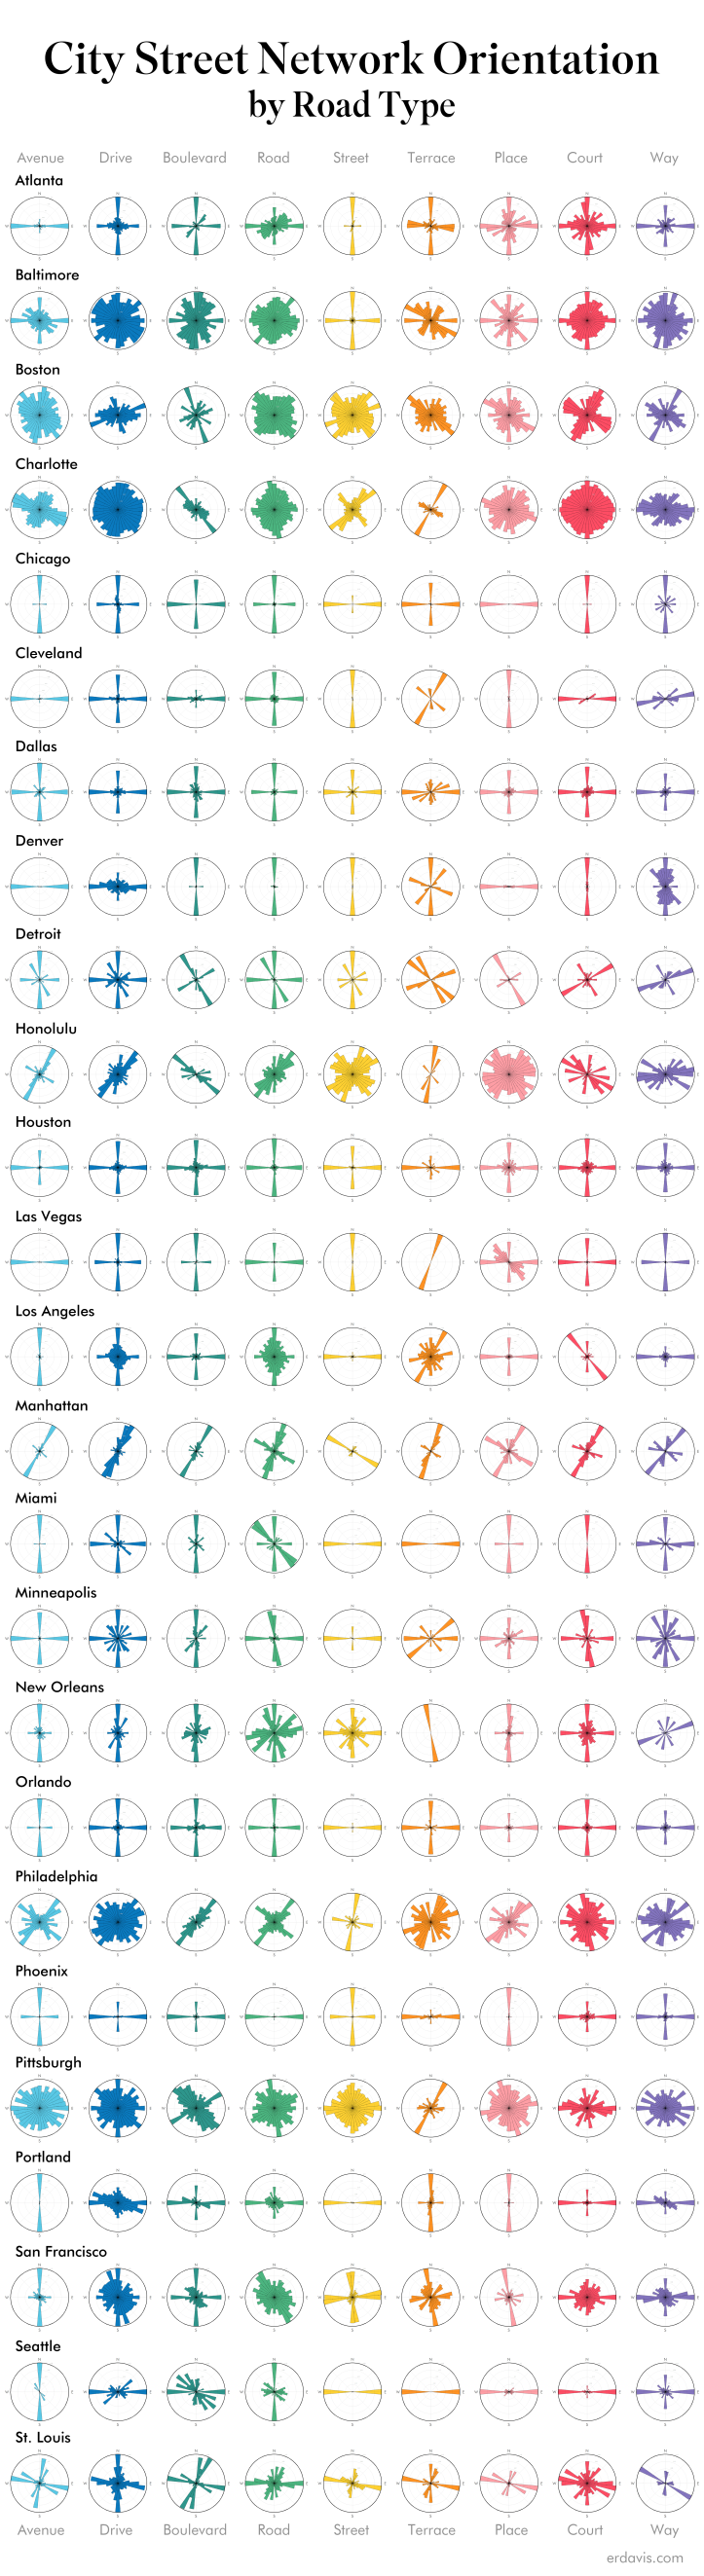
Geoff Boeing’s Street Network Orientation visualization really caught my imagination when it was published last year. It’s such a simple, beautiful way to illustrate the patterns around us we may not otherwise notice.
On my Beautiful Hidden Logic of Cities work, lots of Reddit comments mentioned that Avenues in their city tend to run north-south (or east-west), and Streets ran east-west (or north-south).
There seemed to be opportunity to combine these two concepts to show the directions each road type tends to run. It also seemed like a fun challenge to implement the concept in R.
My finished code can be found here. It’s not as fast and clean as the original, but I’m pleased that it works! Feel free to use it for your own cities.
US Cities
And indeed, the prevailing direction of Avenues tends to be north-south or east-west, and Streets tend to be orthogonal to the Avenues.
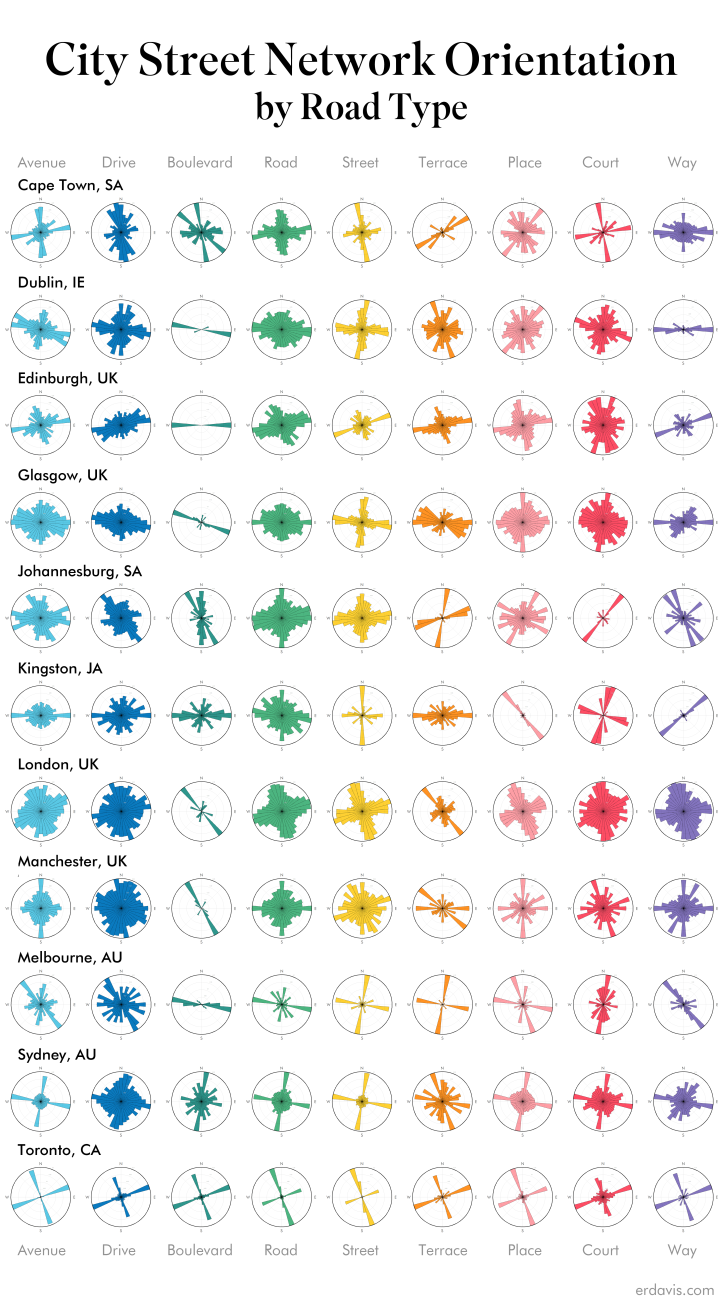
Cities Worldwide
Outside of North America, road grids tend not be, well, grids.

[…] within the grid system. This grid street pattern is visualized beautifully in Data Stuff's Street Network Orientation by Road Type. In Street Network Orientations by Road Type small compass roses are used to show the orientation […]
LikeLike
Hi Have you done any study on the city of Buenos Aires?
LikeLike
[…] Update: found a little nugget that broke down street network orientation by road type in each city […]
LikeLike