It’s been a garbage month in a garbage year. I had to put down my constant companion, my sweetest little buddy, my cat Fergus, and although it’s been a week I’m still tripping over my emotions when I least expect it.
So instead of posting new work, I want to clean out my folder of mouldering ideas that I’ll get to “eventually.” It’s time to put these to rest so I can reclaim a bit of my mind as well as my hard drive.
Please enjoy three years of random ideas I started and never finished.
And here’s to a clean start in a clean new year.
PS: the gravestones were drawn by Liana Sposto, who’s been nagging me to let go and move on 🙂
So what’s next?
I was going to put this down at the bottom, but figured most folks wouldn’t actually scroll through all 20-ish abandoned projects to read footnotes.
I can be really hard on myself, especially when it comes to my creative output. I published 12 blog posts and one article in 2020, but that felt inadequate. I had several months-long gaps between posts, and during those gaps I felt gross and unproductive… ignoring the fact that I also have, you know, a full time job.
Seeing all these incomplete projects really brought home to me that I’m not unproductive, that in fact I do a butt-ton of work, but I do have to iterate through ideas until I find the ones that really stick.
I do hope 2021 is a better year for all of us. I have a few goals that I’d like to accomplish, some a bit scarier than others.
- Move this blog off of WordPress.com and on to something that allows more flexibility. I’ve definitely outgrown this site. A major pain point is that it doesn’t allow for Javascript, and I’m really ready to start making interactive content. This goal scares the crap out of me because the only website I have made from scratch was in 2005 and documented my love of Rammstein.
- Make interactive content. Yeah, this also scares the crap out of me (mobile! screen resizing! Javascript :<), but more and more of my ideas would work so much better with a bit of scrollytelling and chart interactivity.
- Make a viz that looks like an Oriental carpet. I just want to.
- Make more visualizations that aren’t maps. I love maps to an inordinate degree but they can be a creative crutch. I want to tell more stories that aren’t geographic in nature.
- Keep on truckin’. Sending my work out into the void is not easy, and I get into fits of wanting to delete everything and disappear from the internet. Just gotta keep on keepin on!
2020
The 50 Largest (last worked December 2020)
The idea was to map the 50 largest… things. Islands, cities, whatever. It was a lot fiddly arranging and labeling and I got bored.


Mountain Names (October 2020)
Just messing around with UK place names, which continue to surprise American me with their hyper-locality. This one is for hill names, but I didn’t find my groove with it and didn’t go further than some exploratory mapping.

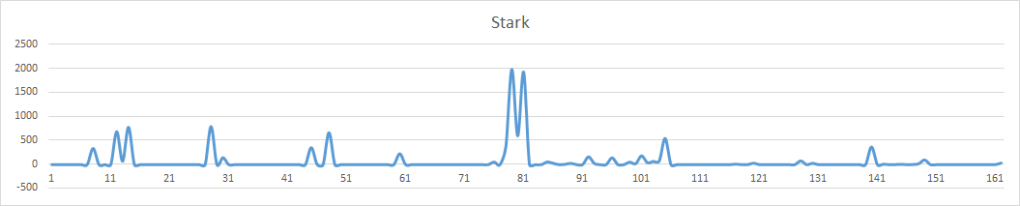
The Rise of Oof (September 2020)
I felt like the word oof had been popping up a lot, and it felt like a very millennial thing to say. I wanted to use Reddit and Twitter data to see when it had started trending. I never got further than some lame default Excel charts.


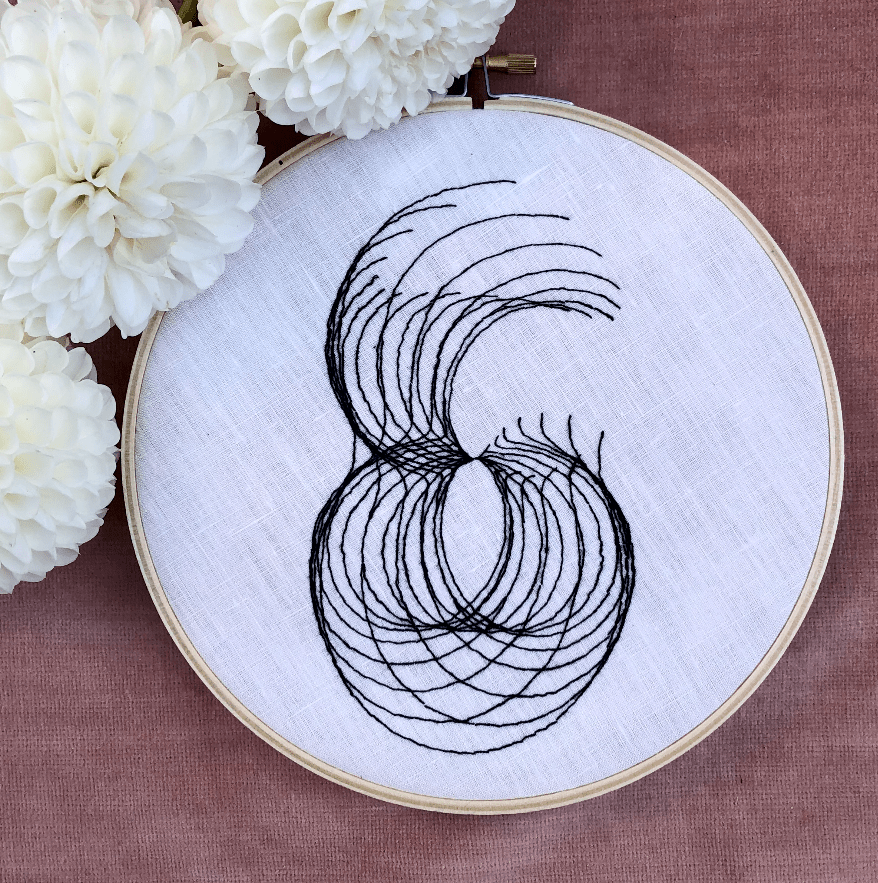
Generative art (August 2020)
I had the brilliant idea of using R to create generative art and then embroidering it. Turns out embroidering nothing but lines is super super boring. I also suck at photographing my embroidery. (But hold this thought! I have a project in the works that combines coding and embroidery and it is not boring!)
Confederate streets (July 2020)
In the summer there was a ton of news of Confederate statues coming down, but I didn’t hear nearly as much about renaming Confederate streets.
I wanted to take a look at how common Confederate-named streets are and where they’re located. I did a little bit of mapping, but decided I really wasn’t the right person to tell this story. I also didn’t really have a direction or a point beyond “Confederacy bad”, and so I let this idea lapse.

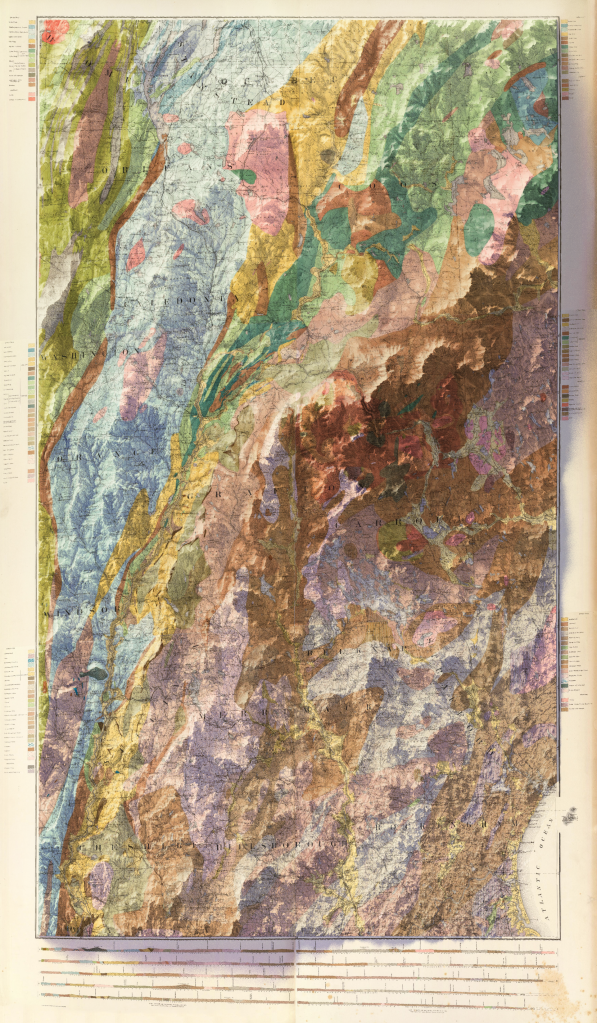
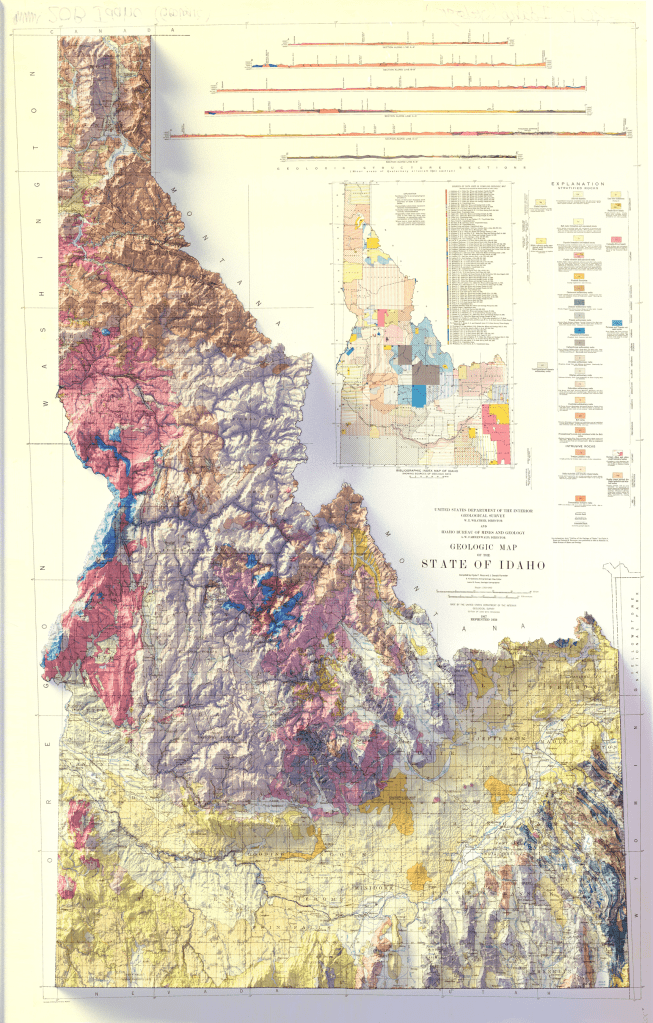
3D maps (June 2020)
These maps were inspired by folks like Scott Reinhard and Sean Conway. Unfortunately, my attempts just don’t live up to their amazing work.


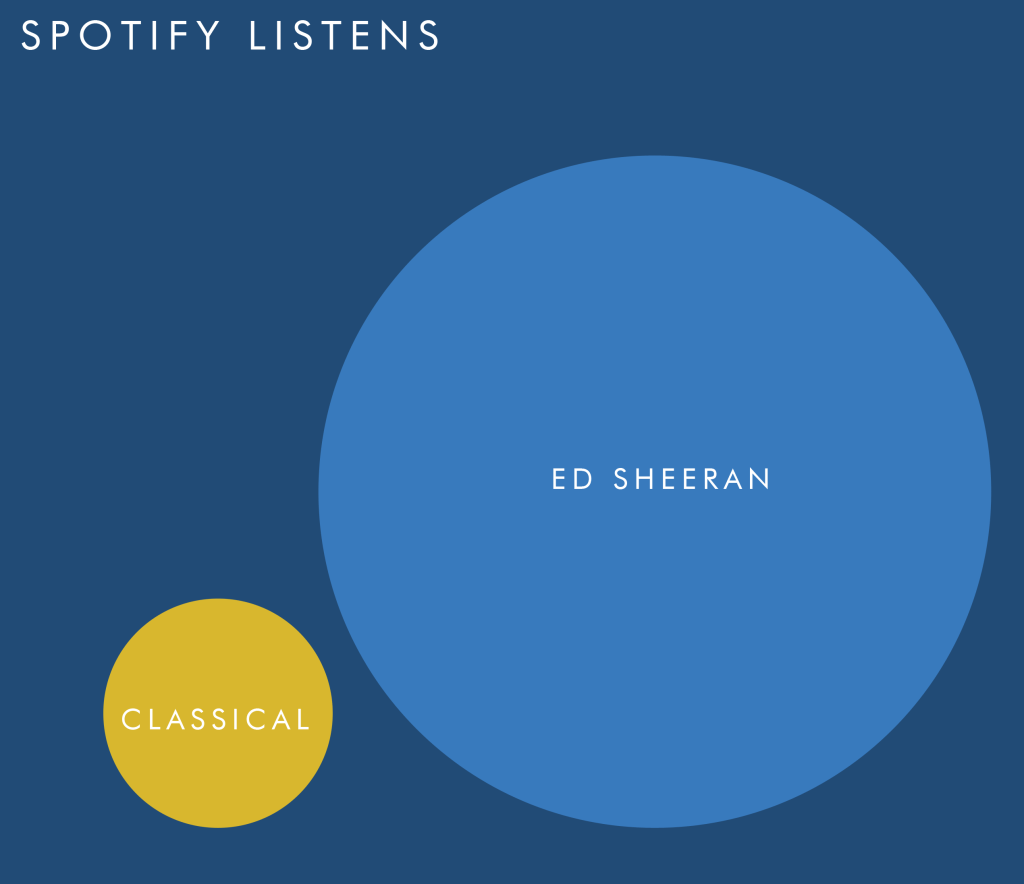
How popular is classical music? (March 2020)
This one hurts to give up on, but I’ve put it off for long enough. The plan was to collect data from a variety of sources (Spotify, Youtube, radio, concerts, album sales) to see how popular classical music is compared to modern artists.
I think it’s a really promising idea, but one that would work better with interactivity (which I can’t implement currently on my cheap lil WordPress site). Also, I only managed to gather Spotify listening data, which is now about a year out of date.
Ugh, I really want to come back to this one, but it just keeps not happening so I think it’s time to move on.

Columbia River Shipwrecks (February 2020)
The Columbia River Bar is an exceedingly dangerous place for ships to sail. To this day, there are professional river pilots that do nothing but navigate ships through this area (and, per Wikipedia, earn 180k a year)
This unfinished map, intended to show shipwrecks on the Columbia Bar, was an early (terrible) attempt at terrain rendering. I ended up leaving this project and doing Shipwrecks of the Arctic instead.


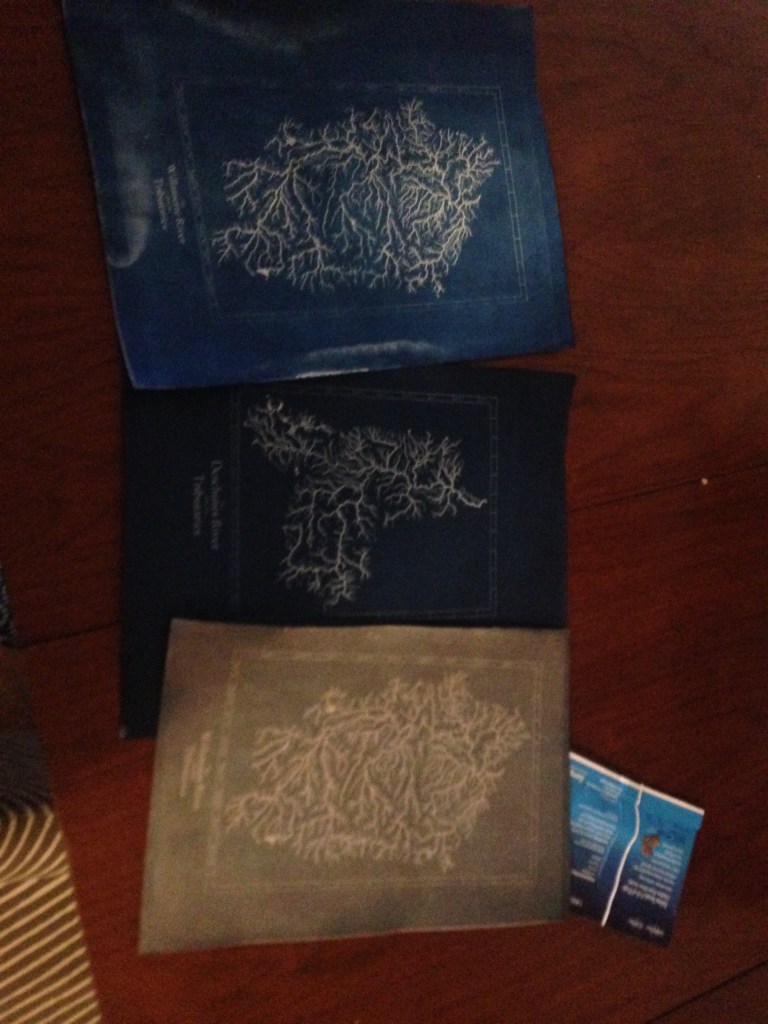
River Watersheds (January 2020)
These were inspired by Daniel Huffman’s cyanotype maps. Late in 2019, I’d gotten the opportunity to sell some of my work at a local coffee shop, and I decided to do a collection of maps relevant to Portland–some watersheds, some neighborhoods, maybe some mountains. Obviously, COVID hit and that plan went up in smoke, but here’s what’s left of it.


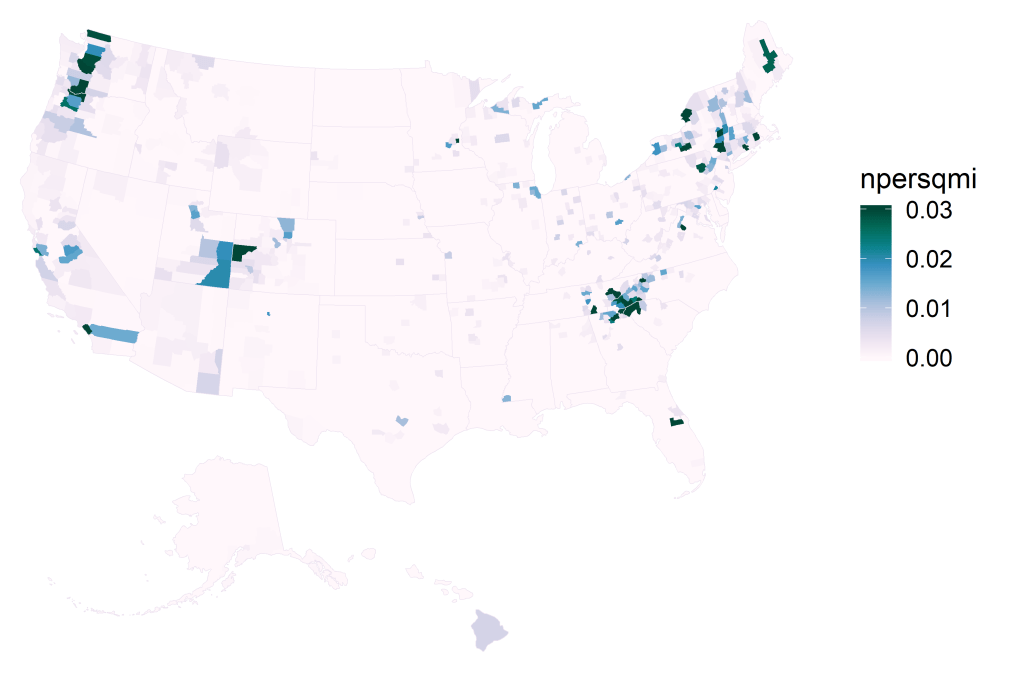
Waterfalls and Churches (January 2020)
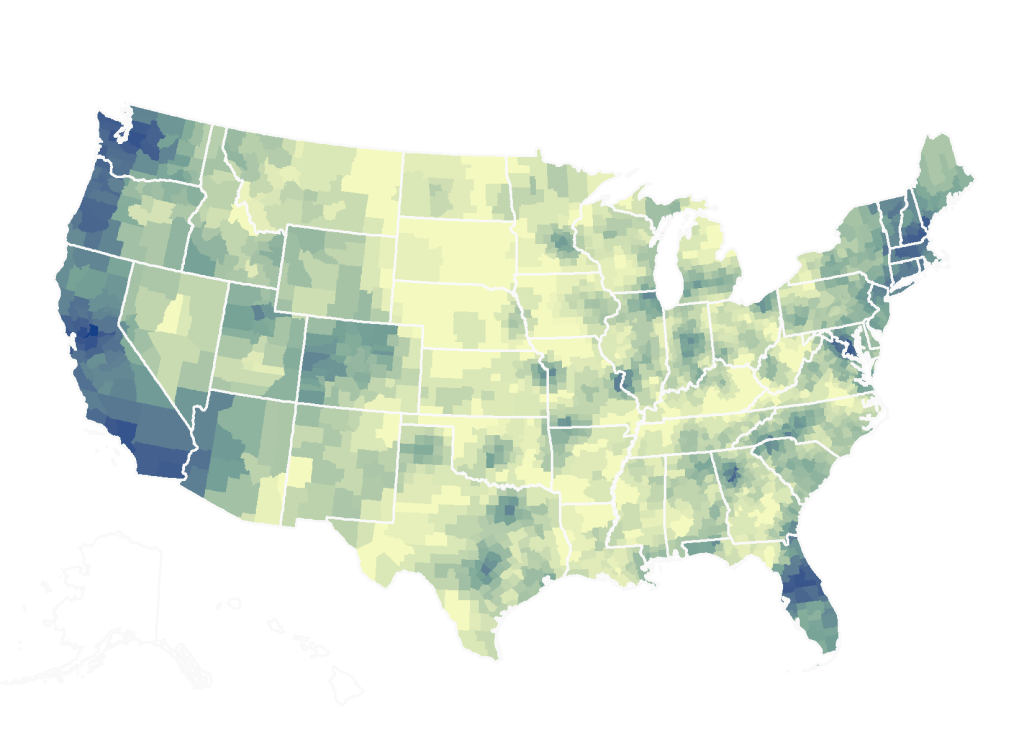
I felt like making a tutorial on how to create choropleths in R using the sf package, and gathered all waterfalls and churches in the USA on Open Street Map.
Obviously the tutorial never came to fruition, but here’s some of the maps.
Waterfalls per square mile:
Churches per capita

2019

Erowid trip reports (December 2019)
Erowid’s a website where folks write up their experiences with drugs. Usually, a user writes up one experience at a time in a form called a “trip report.”
It catalogues a spectrum of behavior, from teens drinking for the first time to heroin users cataloguing their addictions.
This felt like a goldmine of visualize-able data, and I thought about taking it in an artsy direction.
Here, I take one trip report for a given substance. I break it into its sentences. I use a sentiment analyzer to see how positive or negative the sentences are.
Starting at the origin, I map out the whole report as a jagged line: each sentence is a segment. Each segment is at an angle to the prior segment. The more positive the sentiment, the higher the angle. The more negative, the lower.
Finally, all trip reports are superimposed on top of one another to create a comet-like effect.
It looks kinda cool but it definitely needs a lot more massaging before I’d call it complete. I’ve lost interest in this particular idea, but I am sure there is a lot of story potential in the Erowid data.


Draining and filling (October 2019)
Never really established where I was going with these, never felt like they made enough content for a post of their own.


Silly maps (October 2019)
This is my personal blog, sure, but I’m really tough on myself about posting “good enough” content. What I used to post a year or two ago no longer feels “big” enough now.
I felt this way back in 2019 as well, and to break that pattern I decided to create intentionally silly maps.
Here’s one of coloring all the zip codes in order:

Of course, I lost confidence in posting these maps and went back to chasing the high of really stressful and complicated projects 🙃
Architectural Digest (September 2019)
The plan with this one was to see if I could quantify how interior design has changed over time by reviewing all Architectural Digest articles ever.
There were really too many problems here, the core one being that I’d really be studying how Architectural Digest changed, not how interior design did.
I never got to the stage of creating visuals, but I do want to pat myself on the back for scraping all Arch Digest articles and then pulling out all the full page spreads. However, it’s 34GB of junk I definitely don’t need to keep any more.

Mapping Google Trends
I will never not want to map time-series Google trends, and I apparently will also never be satisfied by any of my attempts. Life goal: get access to the super-detailed trends data that only news organizations seem to have.

Simpsons (May 2019)
Like the classical music one, this hurts to give up. Pretty much since I started this site, I’ve had it in my “About Me” section as a example of a neat project that I was working on.
But if I haven’t touched it for more than 18 months, I think it’s time to consign it to the graveyard.
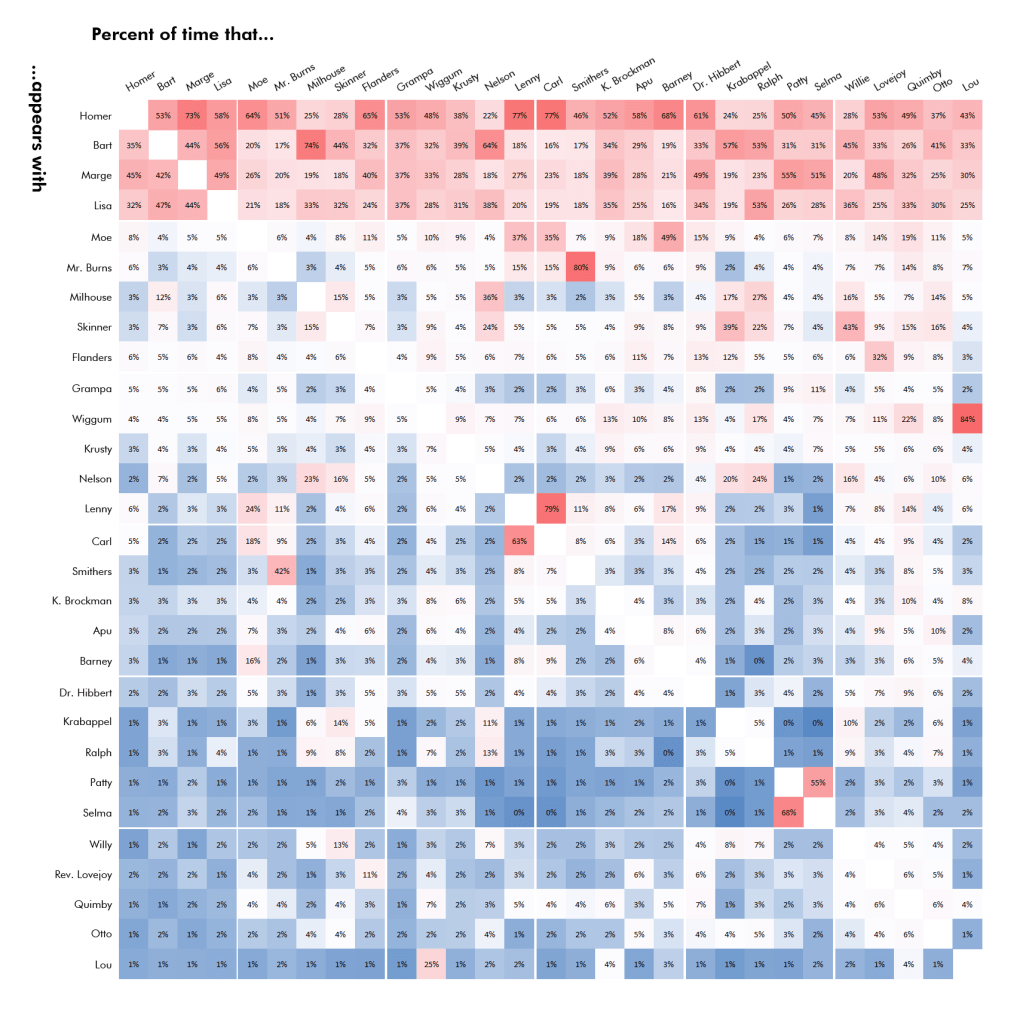
I wanted to analyze Simpsons scripts to see why the show took such a nosedive in quality. In particular, I was interested in how the characters interacted with one another, as I feel that’s what made early episodes such classics.


I was also interested in the imbalance how characters spend time on screen with one another. For example, when Marge is on screen, Homer is there is well about 75% of the time. The converse isn’t true, though–when Homer is on screen, Marge is there only about 45% of the time.
To me this suggests that Marge is presented in the context of Homer. In fact, lots of characters are presented in the context of Homer, appearing more often with him than with any other character (or he with them).
This chart shows a few more interesting tidbits, like that Selma is the more independent Bouvier twin, appearing less often with Patty than Patty does with her.
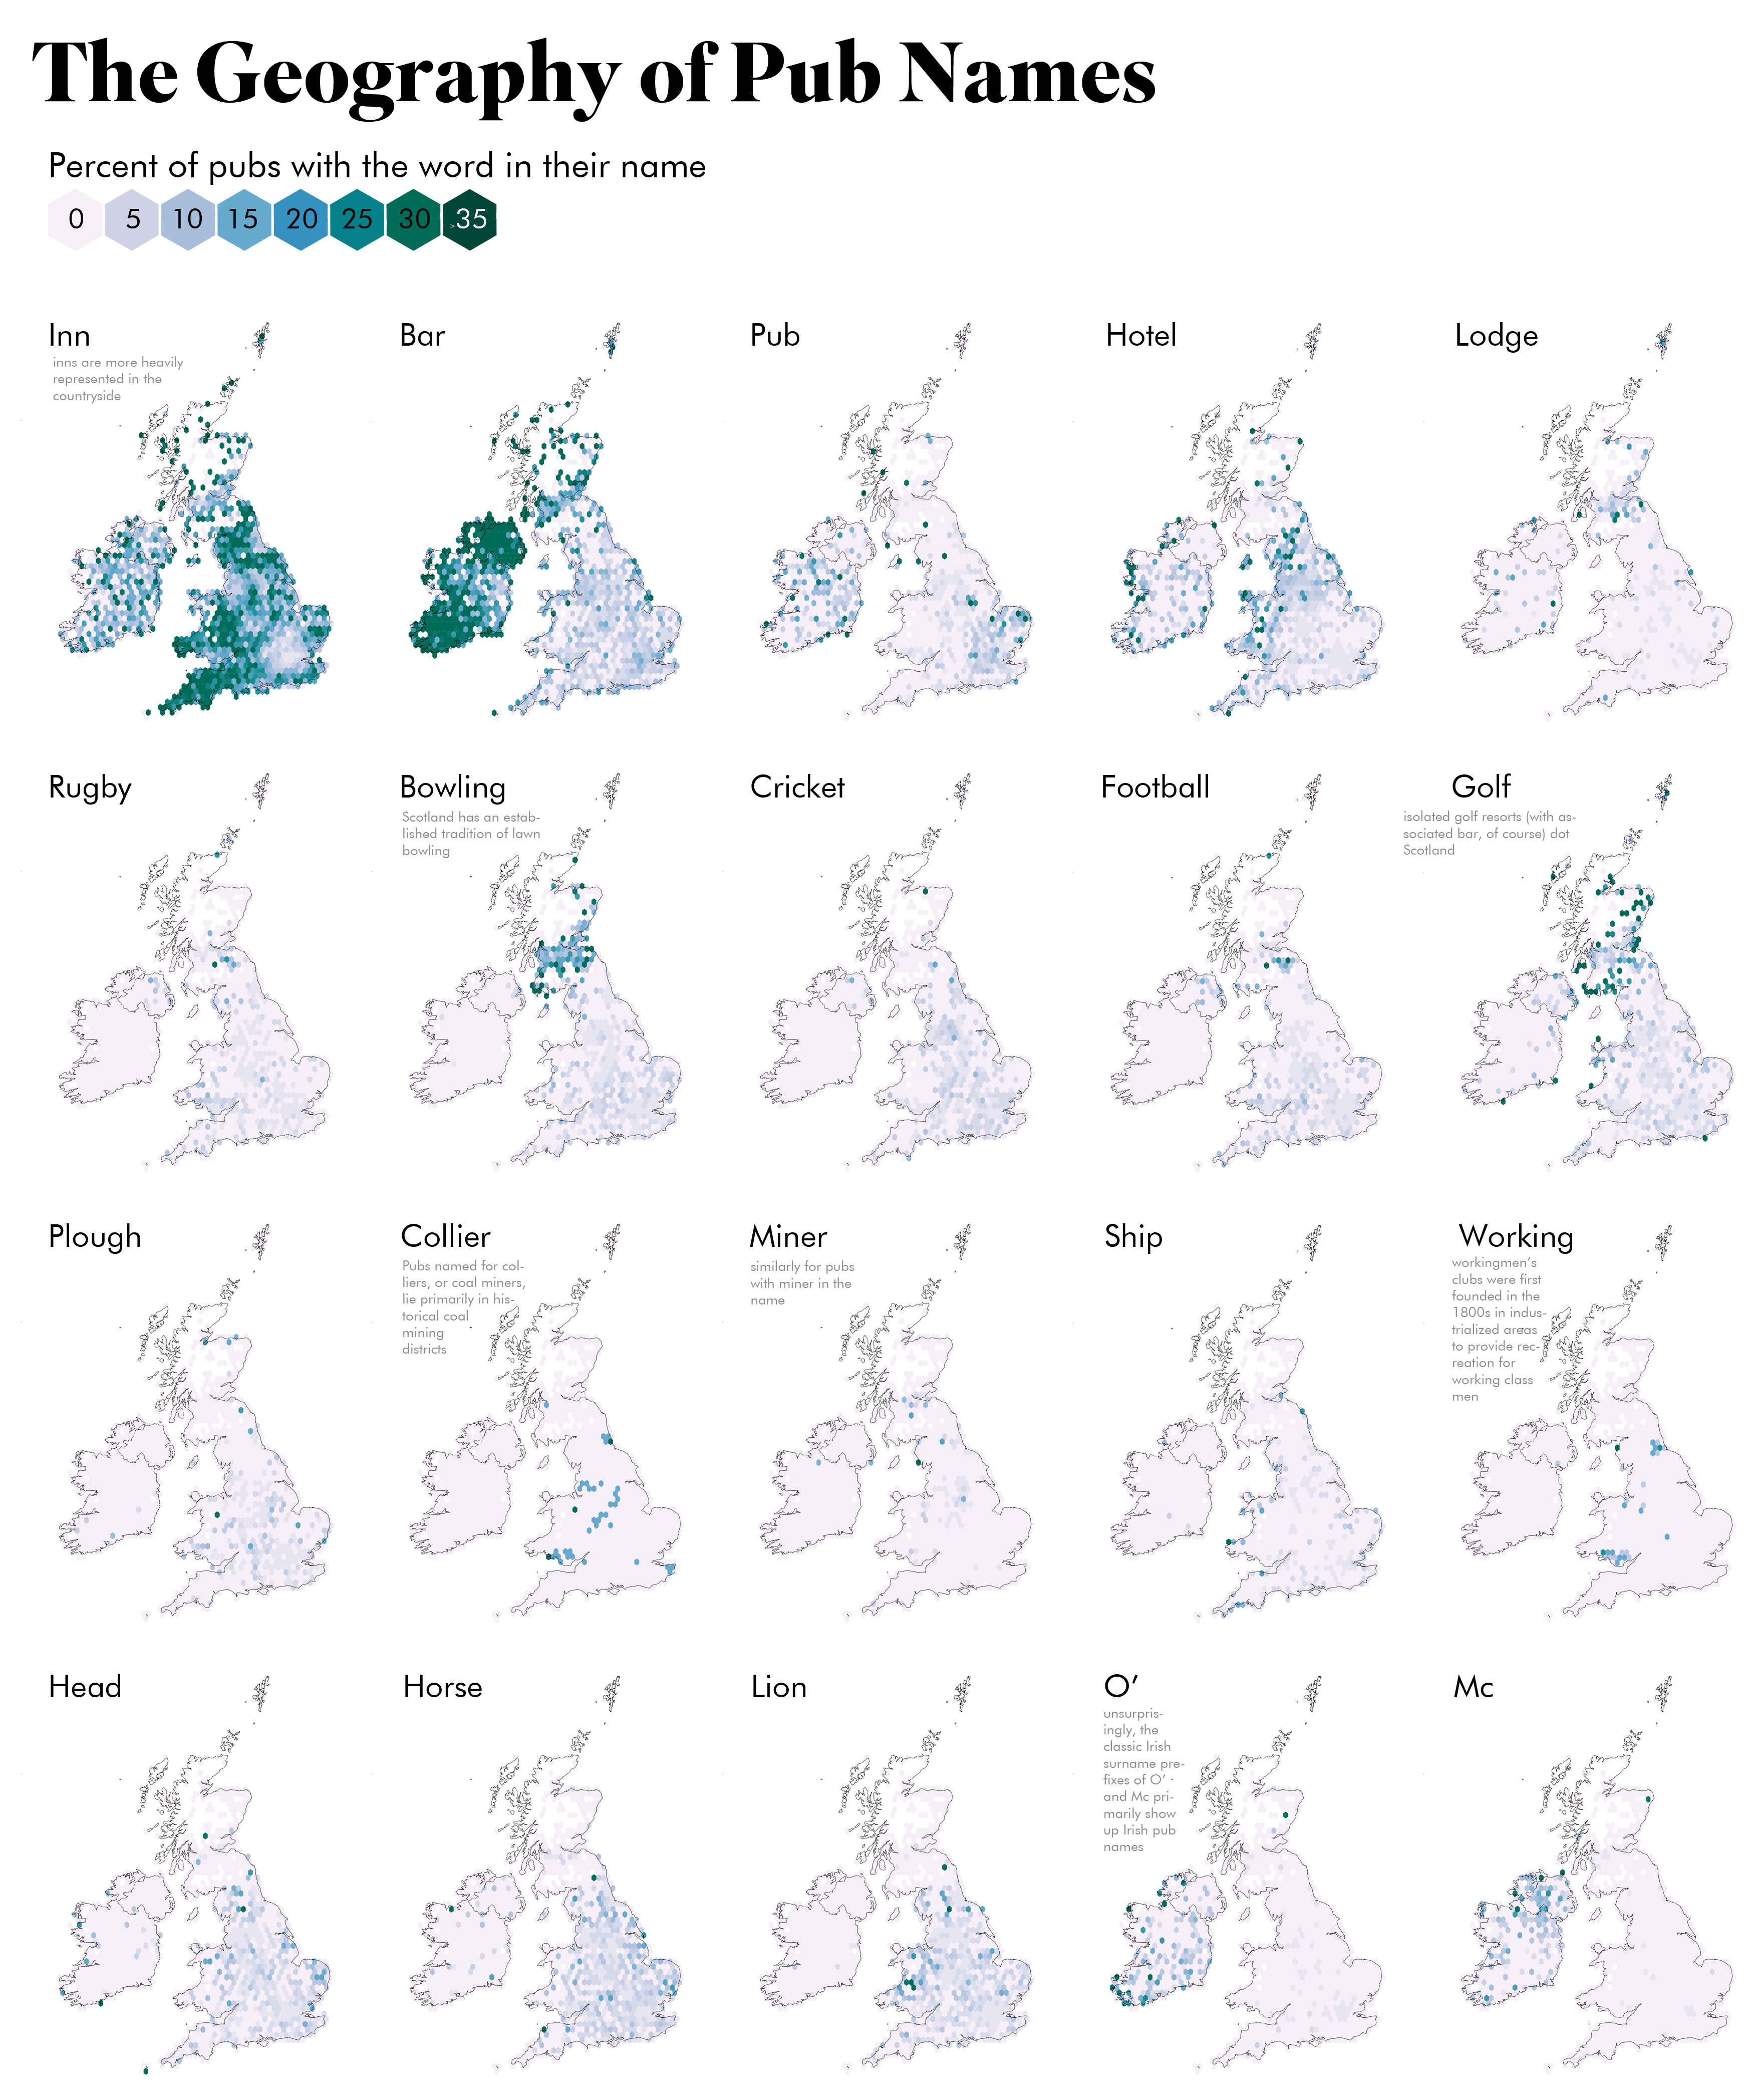
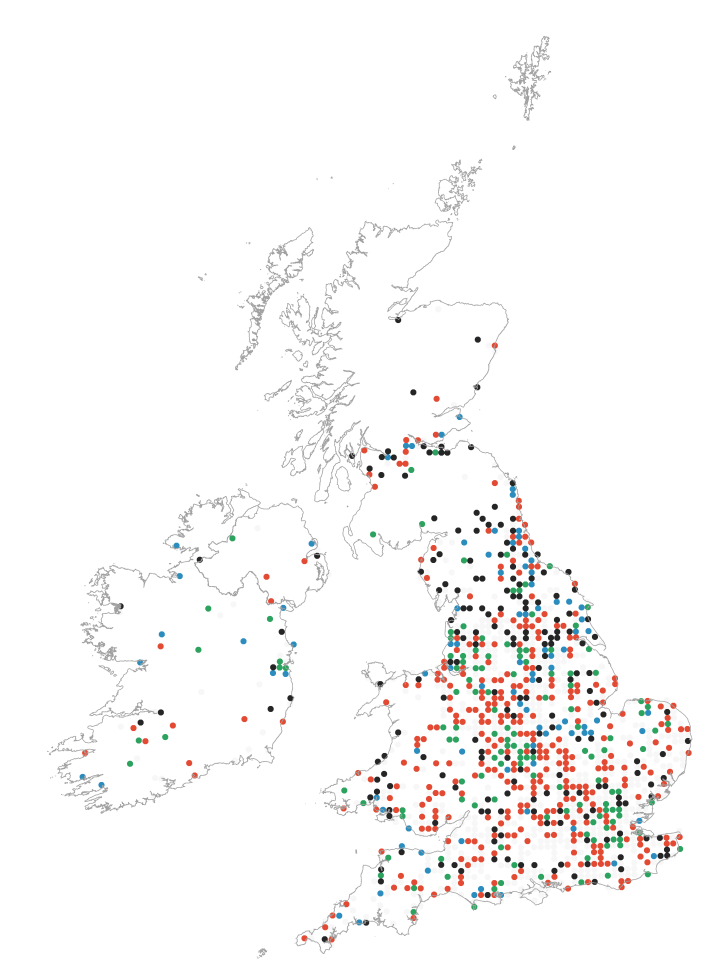
Pub Names (May 2019)
I had lots more plans for the data I gathered for Distance to the Nearest Pub–in particular, analyzing geographical trends in pub names.
I apparently pretty much finished up the project and completely forgot all about it. I don’t really feel like making a whole entire post about it at this point, so into the graveyard it goes.

Portland Vice (January 2019)
Wherever you are in Portland if feels like a bar, pot shop, or strip club is just a stone’s throw away. To honor my town I wanted to use a Voronoi diagram to show which areas are closest to which vices.
Like so many of these projects, I wasn’t thrilled with my early output and so I lost interest and never wrapped it up.

2018

Thai Food (October 2018)
I feel like Thai restaurants are really likely to have the word Thai in their names… more than a Chinese restaurant is to have Chinese in its name or an Italian is to have Italian. They also seem more likely to do a pun on the word Thai, like Beau Thai here in Portland.
This was a really early attempt of mine to scrape Yelp and see if my gut feeling was right.
It’s honestly been so long since I touched this project that I don’t even know what these maps are anymore!

Yelp reviews by street (October 2018)
I think this was a stab at creating a joy plot-like representation of Portland via # of yelp reviews. Each ridgeline would represent the # of Yelp reviews for every business on each block of a major street.
Still think this is kind of a cool idea, but not cool enough to pursue further.


Some awesome stuff in here! Sorry about your kitty though 😞
I don’t know if it will meet your requirements but I love Carrd. It’s very Squarespace-y but better in every way in my opinion. It’s primarily one-page vertical websites but you can create multiple pages and have horizontal content to an extent. It’s easy to use even on mobile and you get 10 sites for $20/year. Probably my favorite thing though is a single guy runs it and that does wonders for its level of polish. Really good communication, documentation, and he will even reply to technical issues and suggestions on Twitter. You may need a from scratch website like you said though.
LikeLike
Ooh, thanks for the recommendation! I’ll check it out–the example sites they have up look really slick
LikeLike
Thanks so much for taking the time to put this together. As another person with a full-time job and like 3 hobbies besides dataviz, I’m often embarrassing by how little traction I’m getting on presentable dataviz projects, especially when a lot of you’re throwing away, I’m aspiring to!
Later this year, I think I learned a lot about iterating towards strong stories/ideas, rather than any hard coding/viz skills—and even though that means killing more and putting out less, I hope it’s still growth.
Anyway, so this transparent documentation was exactly what I needed.
Be well in the new year!
>
LikeLike
Gosh, yeah, iterating is hard. My struggle is that when I don’t get it right on the first try, I give up. Here’s to hoping 2021 isn’t an iteration of 2020!
LikeLike
As usual, I love your post. What a great idea to make a post about all the ideas you didn’t get to. Yours is one of the few blogs I read all the way through each time a new post comes out. Your work is inspiring!
LikeLike
That is so kind of you, thank you! I really, really appreciate hearing that 🙂
LikeLike