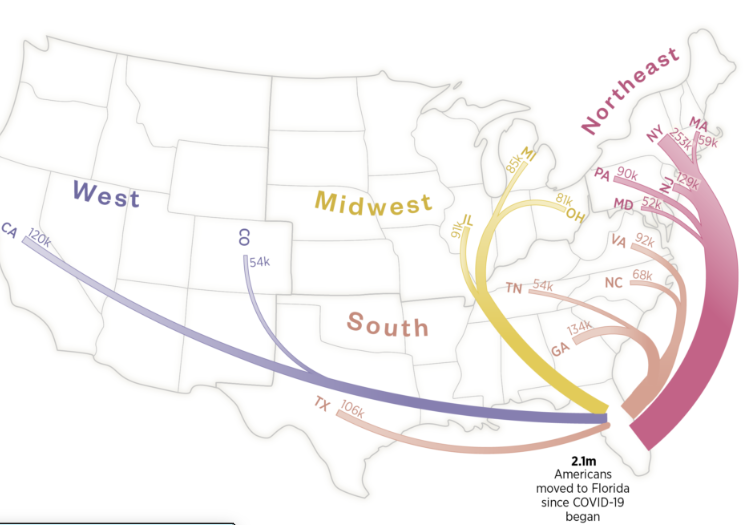
Selected professional projects, large and small, that show the breadth of work I do
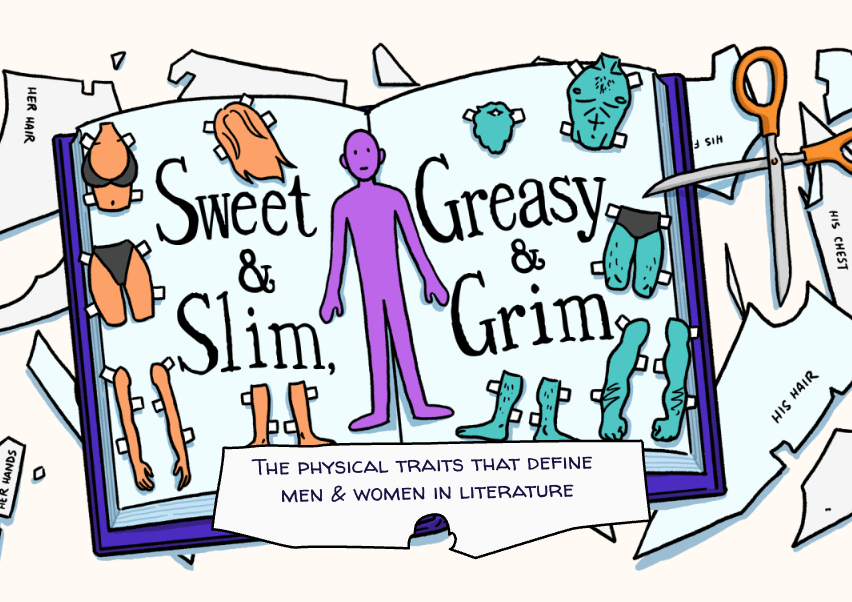
The physical traits that define
men & women in literature
The pudding · july 2020
I analyzed 2,000 novels to see how authors wrote about the bodies of their male and female characters. I uncovered significant differences in both the body parts mentioned for each gender as well as the adjectives used to describe them. I worked with illustrator Liana Sposto to bring my findings to life.
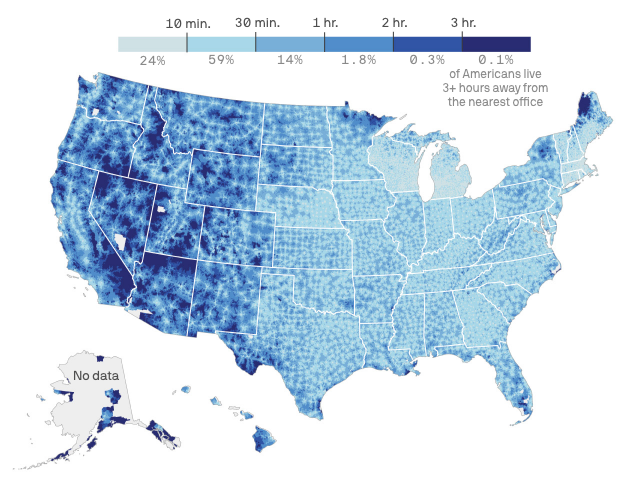
SAVE Act would mean long drives for millions of American voters
Axios · March 2026
I analyzed how the SAVE Act’s in-person voting registration requirement could result in long drive times for Americans. I built a national drive-time model using local election office locations, OSRM driving routes, and population-weighted census date, then visualized the results.
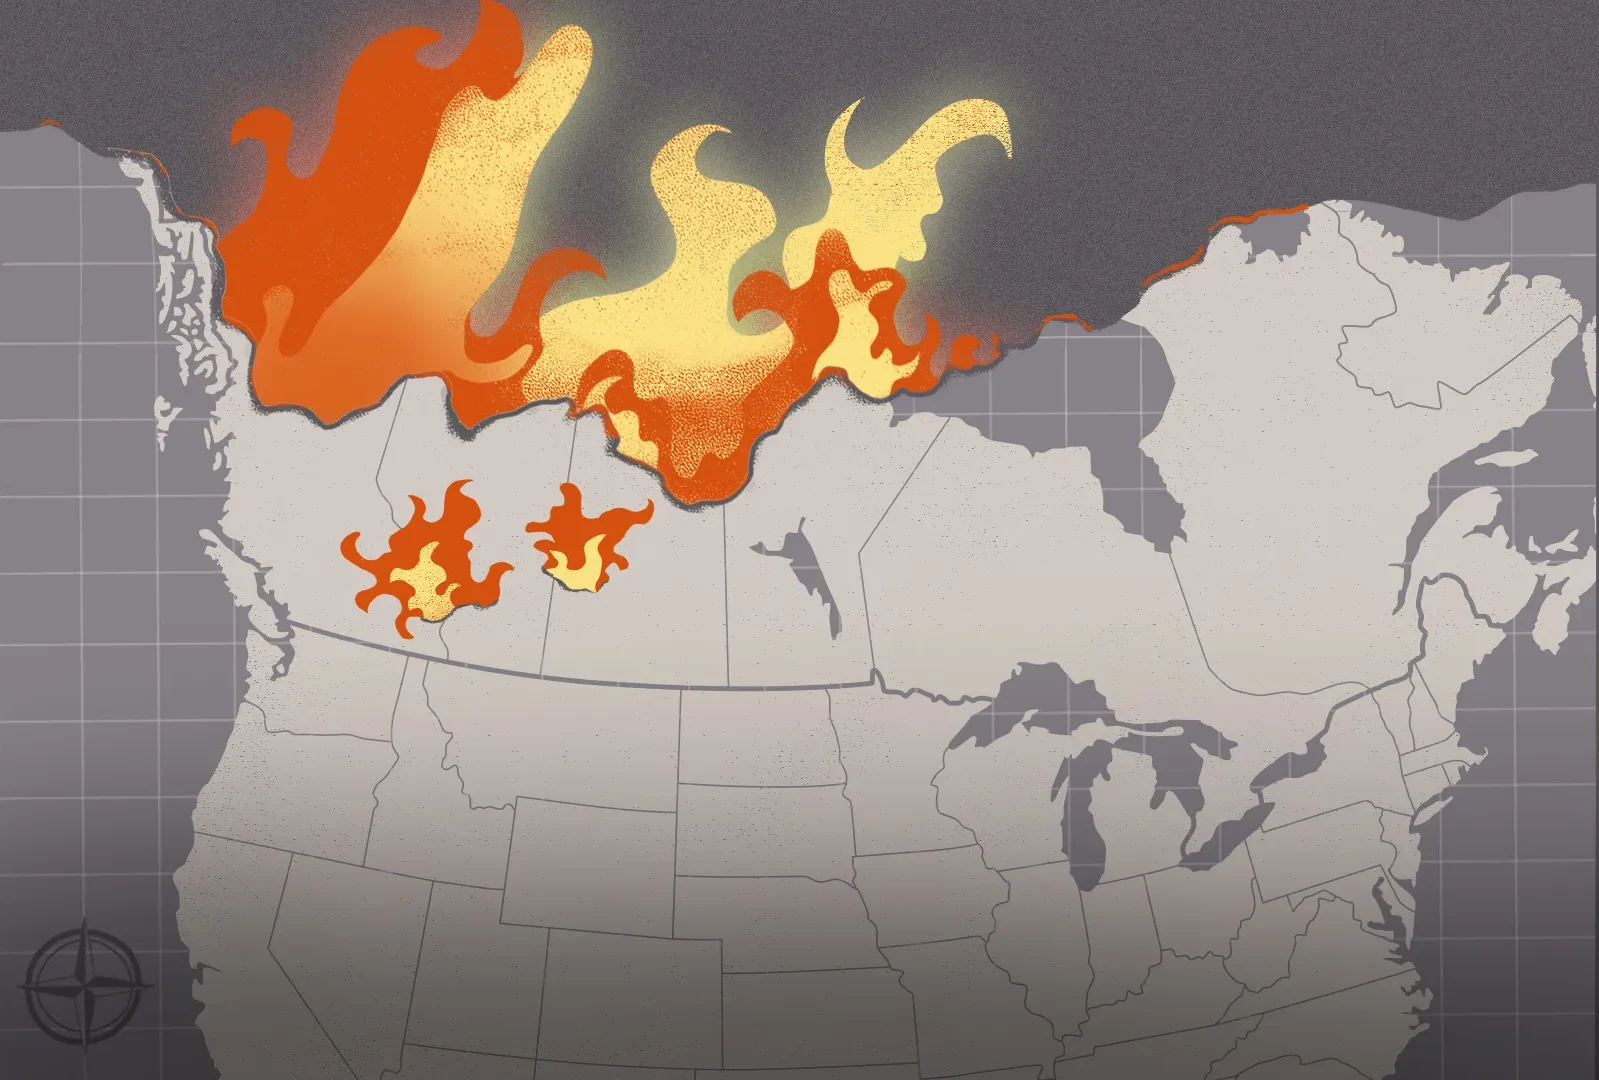
How Canadian wildfires devastated U.S. air quality
Axios · december 2023
I contributed maps and data analysis to this Axios longform piece. In particular, I processed the data for the scrolling smoke animation at the top, and created the annual smoke density maps further down.
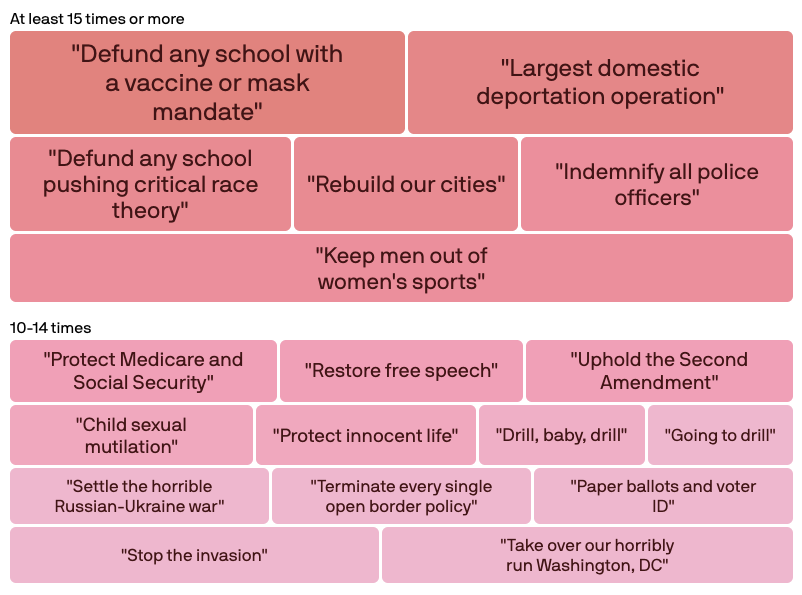
Trump’s favorite words: Policy ideas he talks about most
Axios · april 2024
I analyzed more than a year of Trump’s public remarks to find which ideas he returned to again and again. The final piece turned a sprawling body of campaign rhetoric into a clear visual analysis.
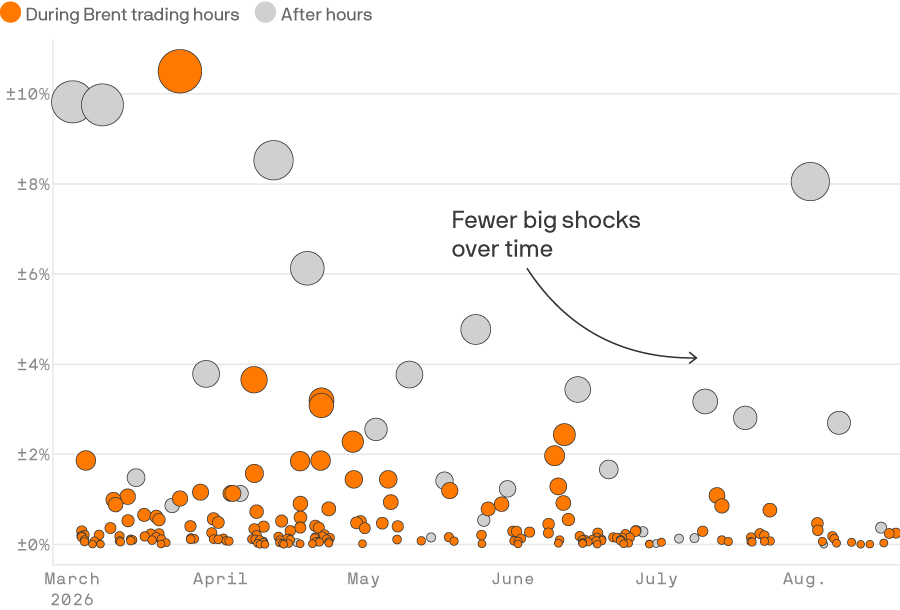
Oil markets are tuning out Trump’s “truths”
Axios · August 2026
I used minute-by-minute oil futures pricing to show tha over time, there have been fewer and fewer sharp changes in price in response to Trump’s social media posts.
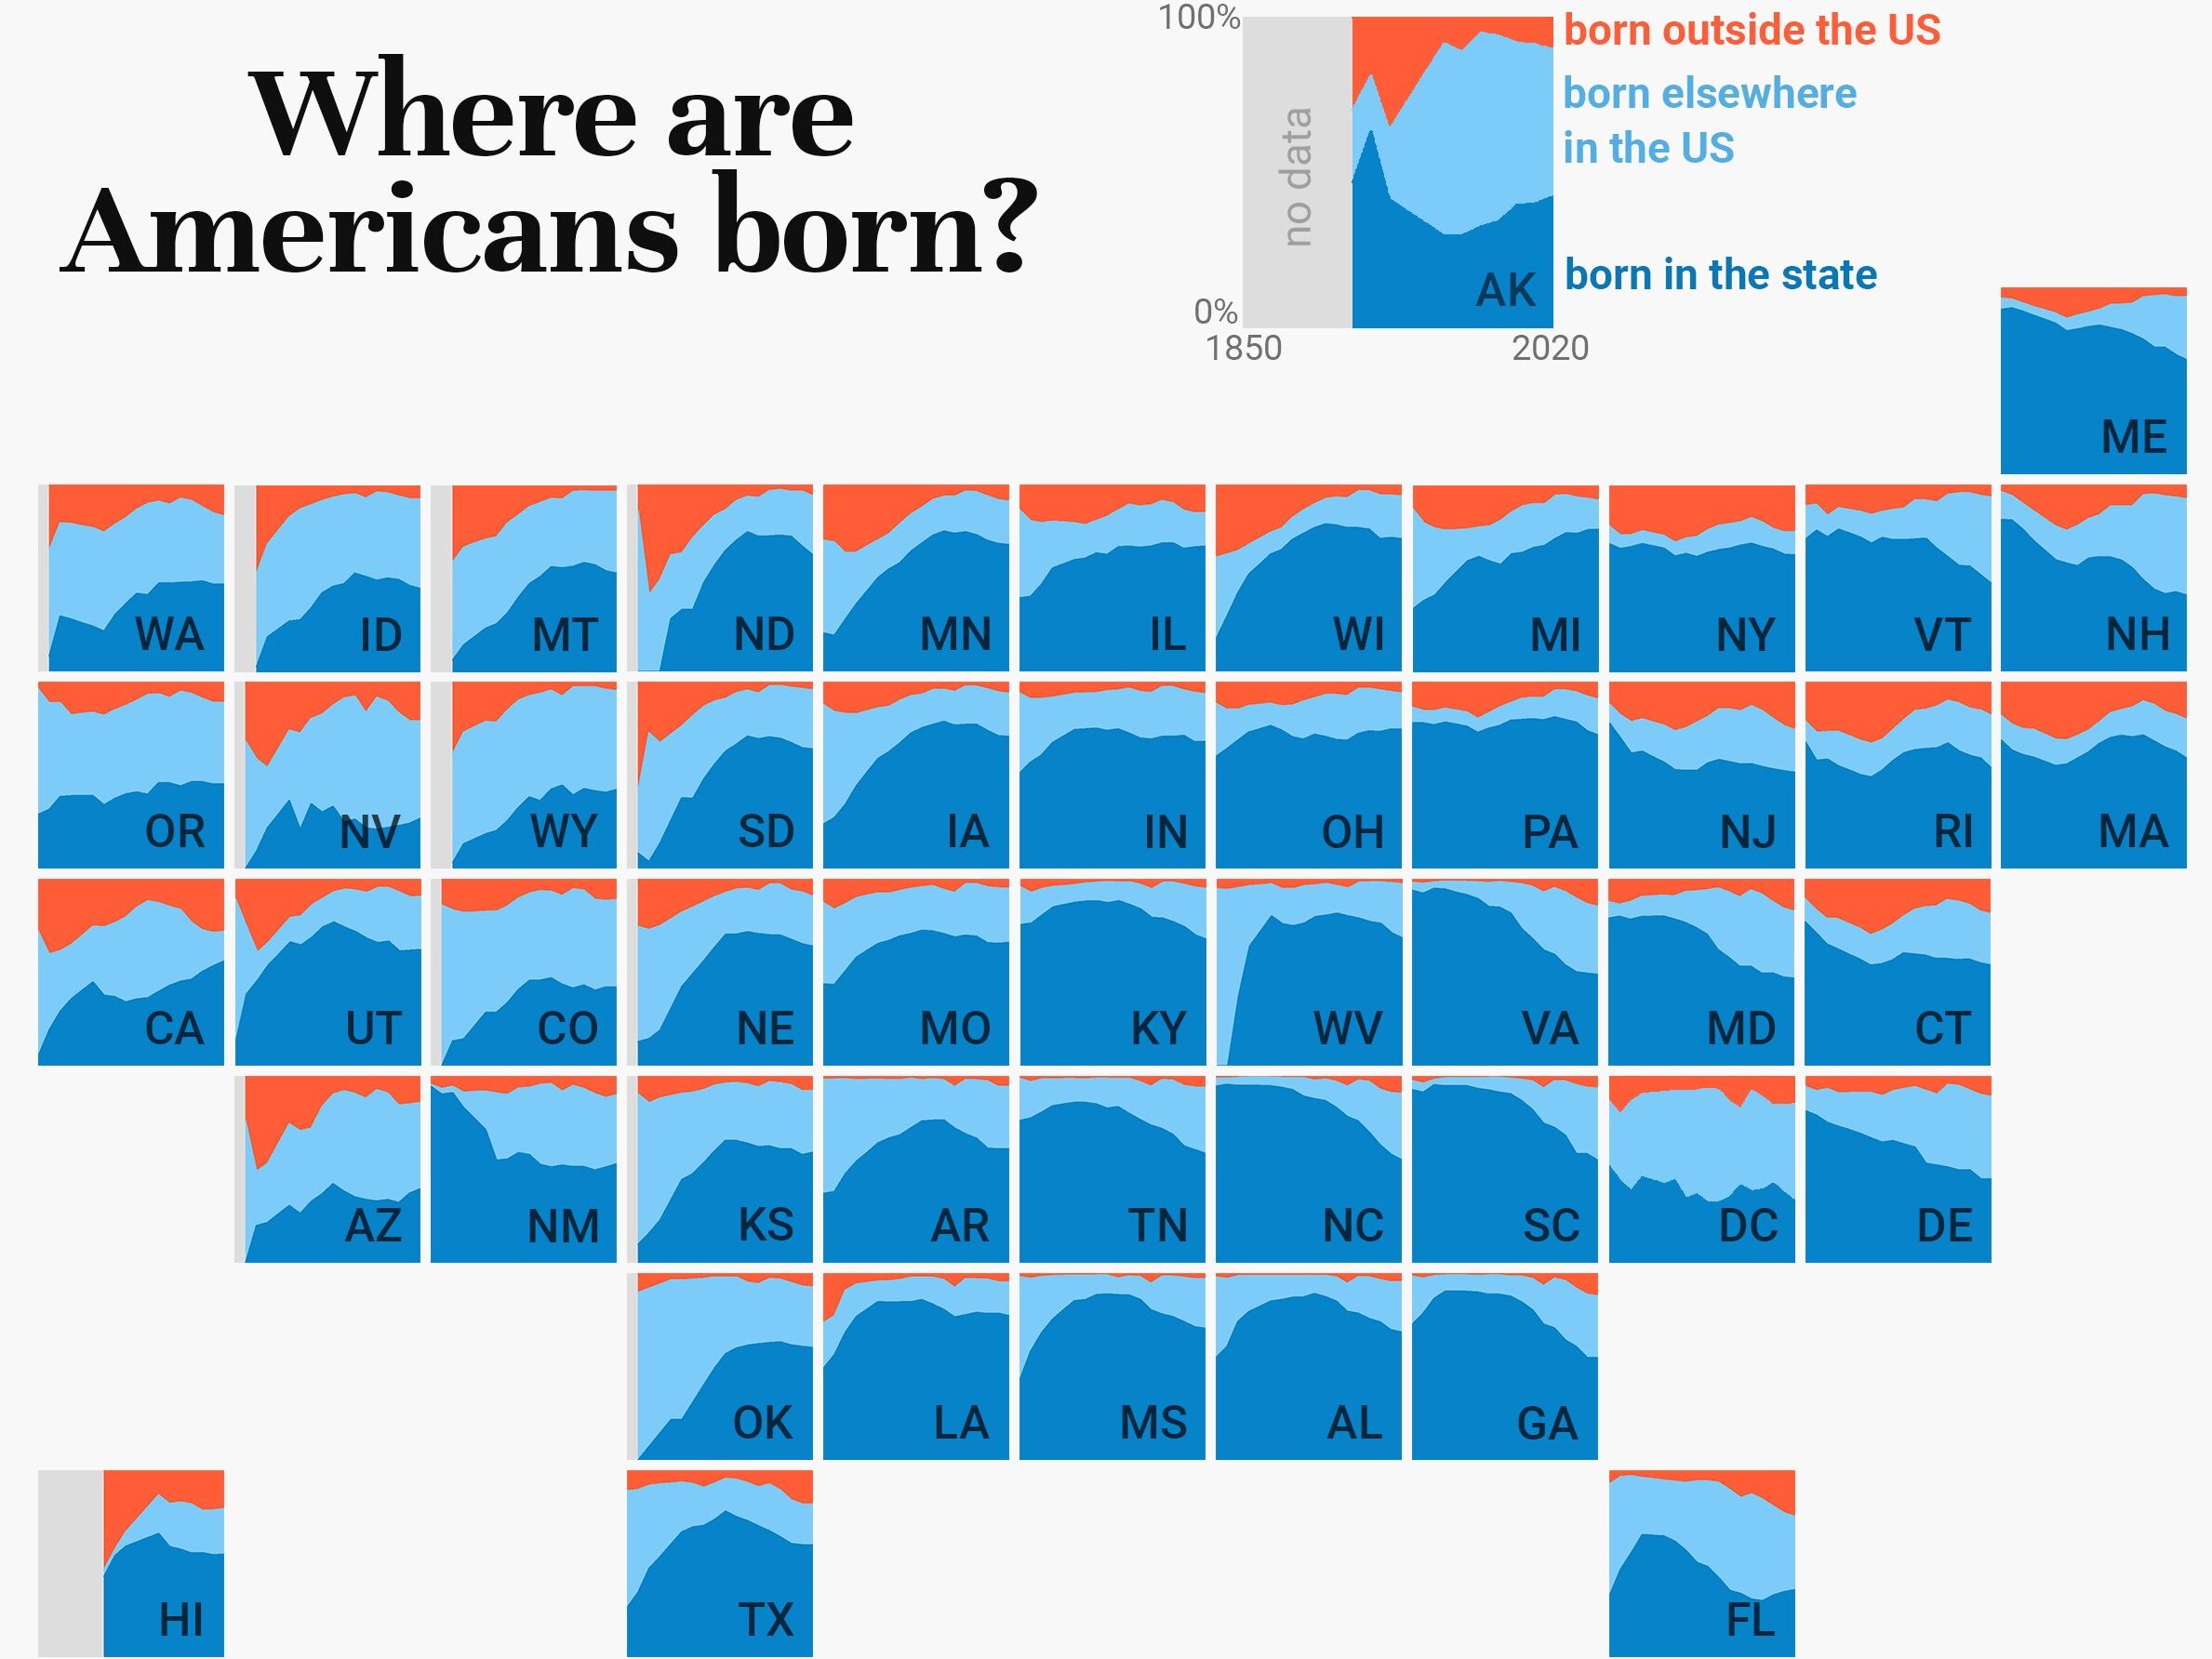
Where are Americans born?
1point21 · february 2022
I looked at where Americans were born, in each state and over time. My fun and attention-grabbing “chartogram” that went viral on Twitter and helped me get my current job at Axios!
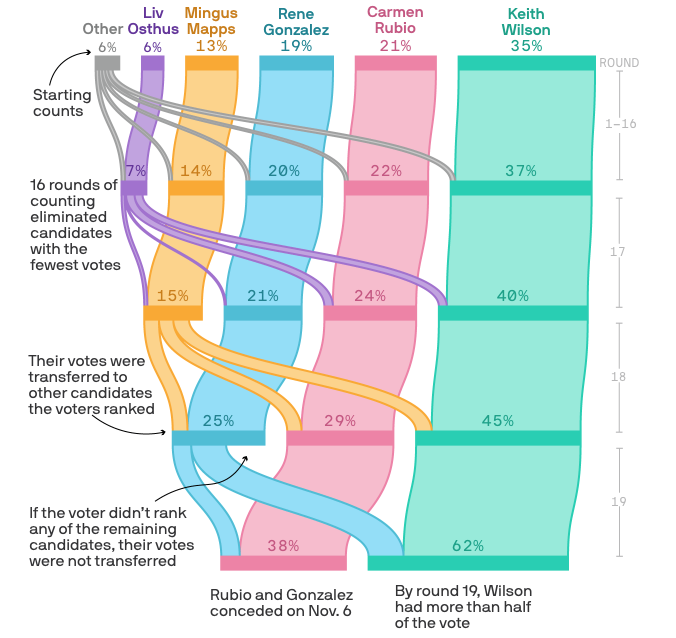
Where your mayoral vote went
Axios · November 2024
I visualized the vote-counting process of Portland’s 2024 mayoral race. This was the first time the city used ranked-choice voting, so a visual explainer was important reader service.