First things first: I couldn’t think of anything better to call this project, so the poorly-defined “Topography of Tea” will have to do.
Second things second: my office provides a sampling of Bigelow teas. The staples, like English Breakfast, plain green tea, and mint tea, tend to always be in stock, but whoever purchases these things occasionally goes wild and buys some improbable-sounding flavors.
Staring at a box of eggnog-flavored tea at work sparked the questions that lead to this project: What tea flavors are out there? And what flavor combinations are the most common?
Gathering Data
At first, I wanted to limit the universe of teas to survey by only gathering flavors in stock at my local Fred Meyer. I went to far as to get a clipboard and paper and go to the tea aisle. That plan was very quickly scrapped, though, when I saw that a) it was uncomfortable and b) it would take forever.
Instead of gathering flavors in the field, I went with what I should have done first and harvested data directly from the web. However, I did limit the universe of teas to just those offered by brands in stock at that Fred Meyer.
One quirk of the data I didn’t expect is that the flavor on the box doesn’t always line up with the ingredient list. For example, many fruit-flavored teas don’t actually have those fruits in the ingredients–instead, they’re credited as “natural flavorings.”
Teas also have ingredients that don’t show up in the flavor descriptions. Chicory, for example, seems to be in many herbal teas, but is rarely included in the copy on the box. My best guess is it’s mostly there to add bulk to the tiny amounts of spices used for the actual flavor.
Therefore, instead of scraping raw ingredient lists, I used my human judgement to read the descriptions of each tea and decide what the marketed or intended flavor was.
Results
I gathered information on 387 teas distributed by 6 brands: Bigelow, Celestial Seasonings, Lipton, Stash, Tazo, and Twinings.
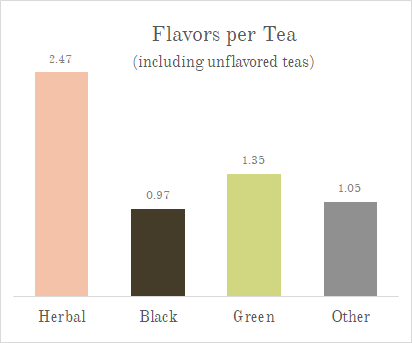
Across those 387 teas I found 89 marketed flavors, including general descriptors like “citrus” or “herbs.” The average tea had 1.7 flavors, but it’s very variable by category:
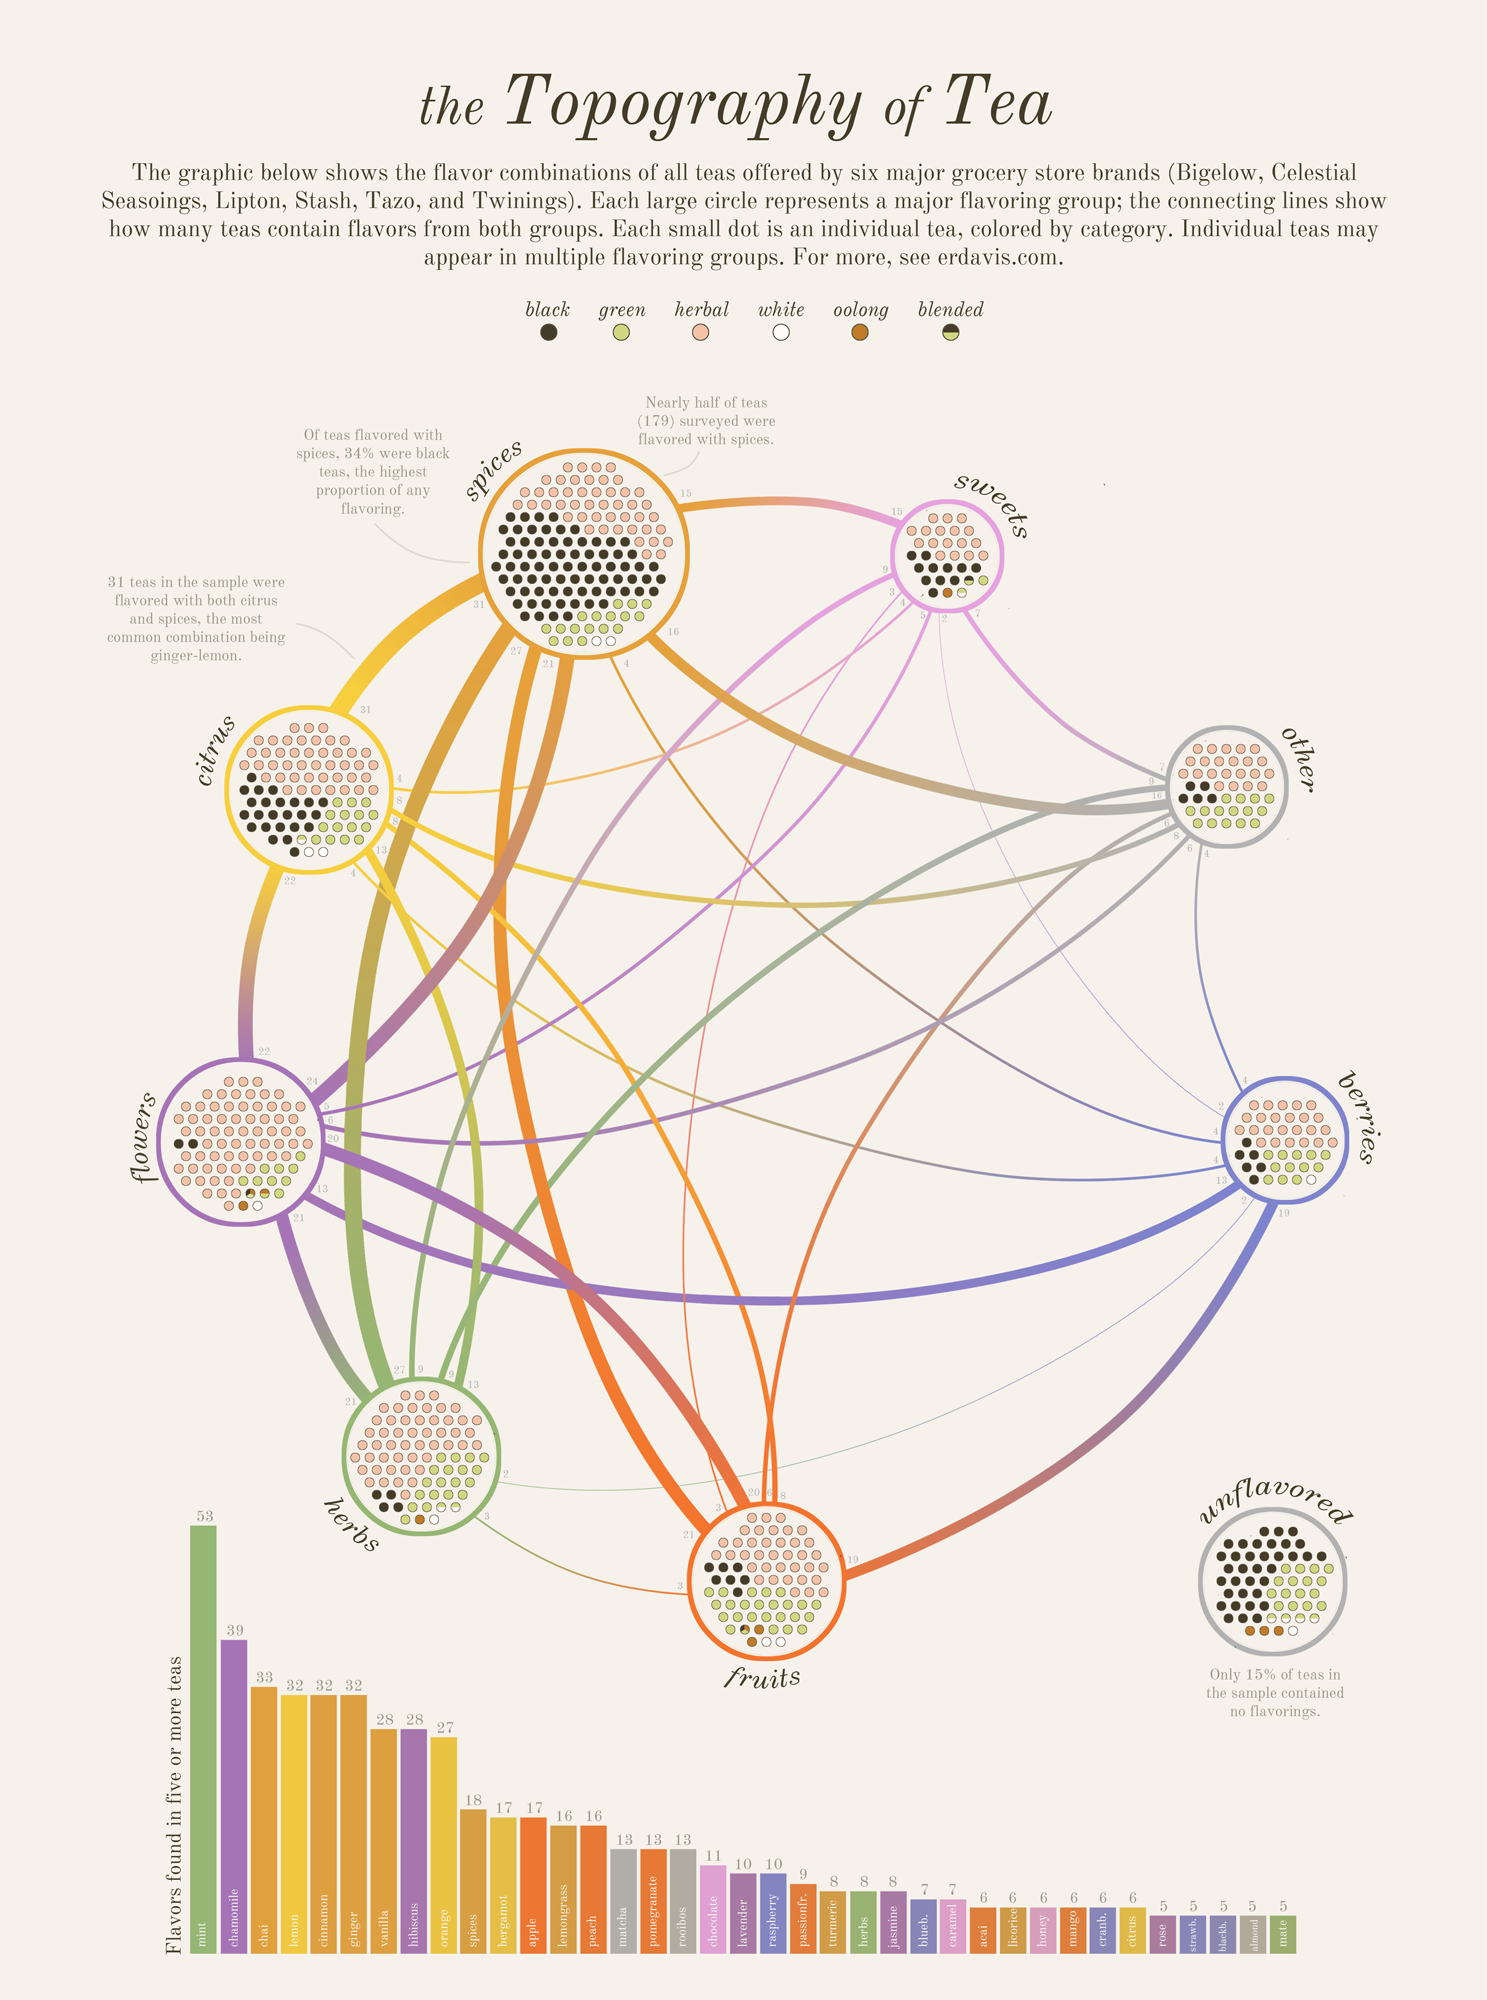
Initially, I wanted to create a network diagram showing the combinations of all individual flavors. With 89 nodes, however, such a diagram is practically unreadable. To increase readability, I grouped individual flavors into categories: spices, citrus, flowers, herbs, fruits, berries, sweets (like chocolate, caramel, and honey), and miscellaneous/other.
I could then create a lovely, clean network diagram in Gephi showing what categories of flavors tend to go together in individual teas.
Each large circle in the diagram below is a flavor category. Each little dot within the larger circles is an individual tea that contains a flavor in that category. Since teas may have more than one flavor, they may appear on the graphic more than once.
What did I learn?
I answered my questions to my own satisfaction: I found 89 individual flavors in teas. Manufacturers combined these flavors to make about 200 unique teas.
Flavor combos, on a granular level, are very diverse. About 43% of teas have unique flavor combinations, and the most common flavor combo, mint-chamomile, is present in only 4% of sampled teas.
When reviewed at a higher level, though, patterns do become apparent. Spices are by far the most common flavorings, and they’re used heavily in combination with citrus, herbs, and flowers.
Black teas are rarely flavored with anything other than spices and citrus, and these grocery store brands overwhelmingly offer herbal, black, and green teas, with very few white or oolong options.
Discover more from Data Stuff
Subscribe to get the latest posts sent to your email.
Very nice! I only wish it was Teapography.