I like to read. I can’t say that the hobby was forced on me, per se, but… look at how my mom dressed me:
I also like dataviz. Sadly viz onesies don’t seem to have been available 30 years ago.
So, of course, it now comes time to make a data visualization about my reading habits. Specifically, those during the year of our Lord 2020.
I almost always read on my Kindle, so luckily it was possible, with some planning and forethought, to automate data collection for the year. More on that at the bottom–Amazon doesn’t make it particularly easy.
So! Let’s dive in.
Overall reading stats
Before I got really into data viz, I read quite a lot more than I do now. The routine was basically: get home from work, flop on the couch, read till bedtime.
Nowadays, it’s: get home from work, futz on the computer until my eyes hurt, read till bedtime.
Still! I put up some solid stats in 2020, but I’d love to see my reading data from, say, 2014. You know, for ultimate sad nerd bragging points.
What did I read?
A whole bunch of random stuff! Roughly 50/50 fiction vs. nonfiction and 65/35 female vs. male authors.
However, only about 7 of the books I completed were by non-white authors. I am going to make a point in 2021 to diversify my reading!
My most read author (3 books) was Hilary Mantel, who can do no wrong.
It’s hard to pick, but these were probably the top things I read this year (in no particular order)
- Every Day is Mother’s Day by Hilary Mantel: no, actually, she really can do no wrong
- Tyll by Daniel Kehlmann: Mysterious jester bordering on the malevolent travels war-torn 17th century Europe
- Too Much and Never Enough by Mary L. Trump: A really enlightening look into a man that baffles me greatly
This is a particularly personal visualization in that I’m not sure how interesting it is to anyone other than myself. I wanted to see if there were any patterns in my reading progression through each book.
I mostly tend to finish books in one shot over a couple of days, but my favorite part of this chart is seeing those books that I repeatedly put down before coming back to.
When did I read?
An interesting consequence of choosing to do this project in 2020 is that I inadvertently detailed how COVID affected my personal life.
Most obvious is how my 11am lunchtime cuts off abruptly in early March, when my office shifted to a split WFH/in office schedule. There’s also a faint trace of 1pm reading from March-October, where I’d get home and have a bit of time before my at-home shift started.
I can also see when I waited in the emergency vet parking lot after cat #1 got in a bad fight, and I can see the anxious day spent reading and waiting for the vet to arrive to put down cat #2.
Although I’ve sized the bubbles by pages read, I should be clear that this is just an approximation. The Kindle doesn’t provide page numbers–it does something called “locations” instead. I was able to get the number of locations read during each session and the total number of locations in each book. From that, I extracted what percentage of the book I had read and multiplied that by the number of pages in the hardback version.
(click for big)
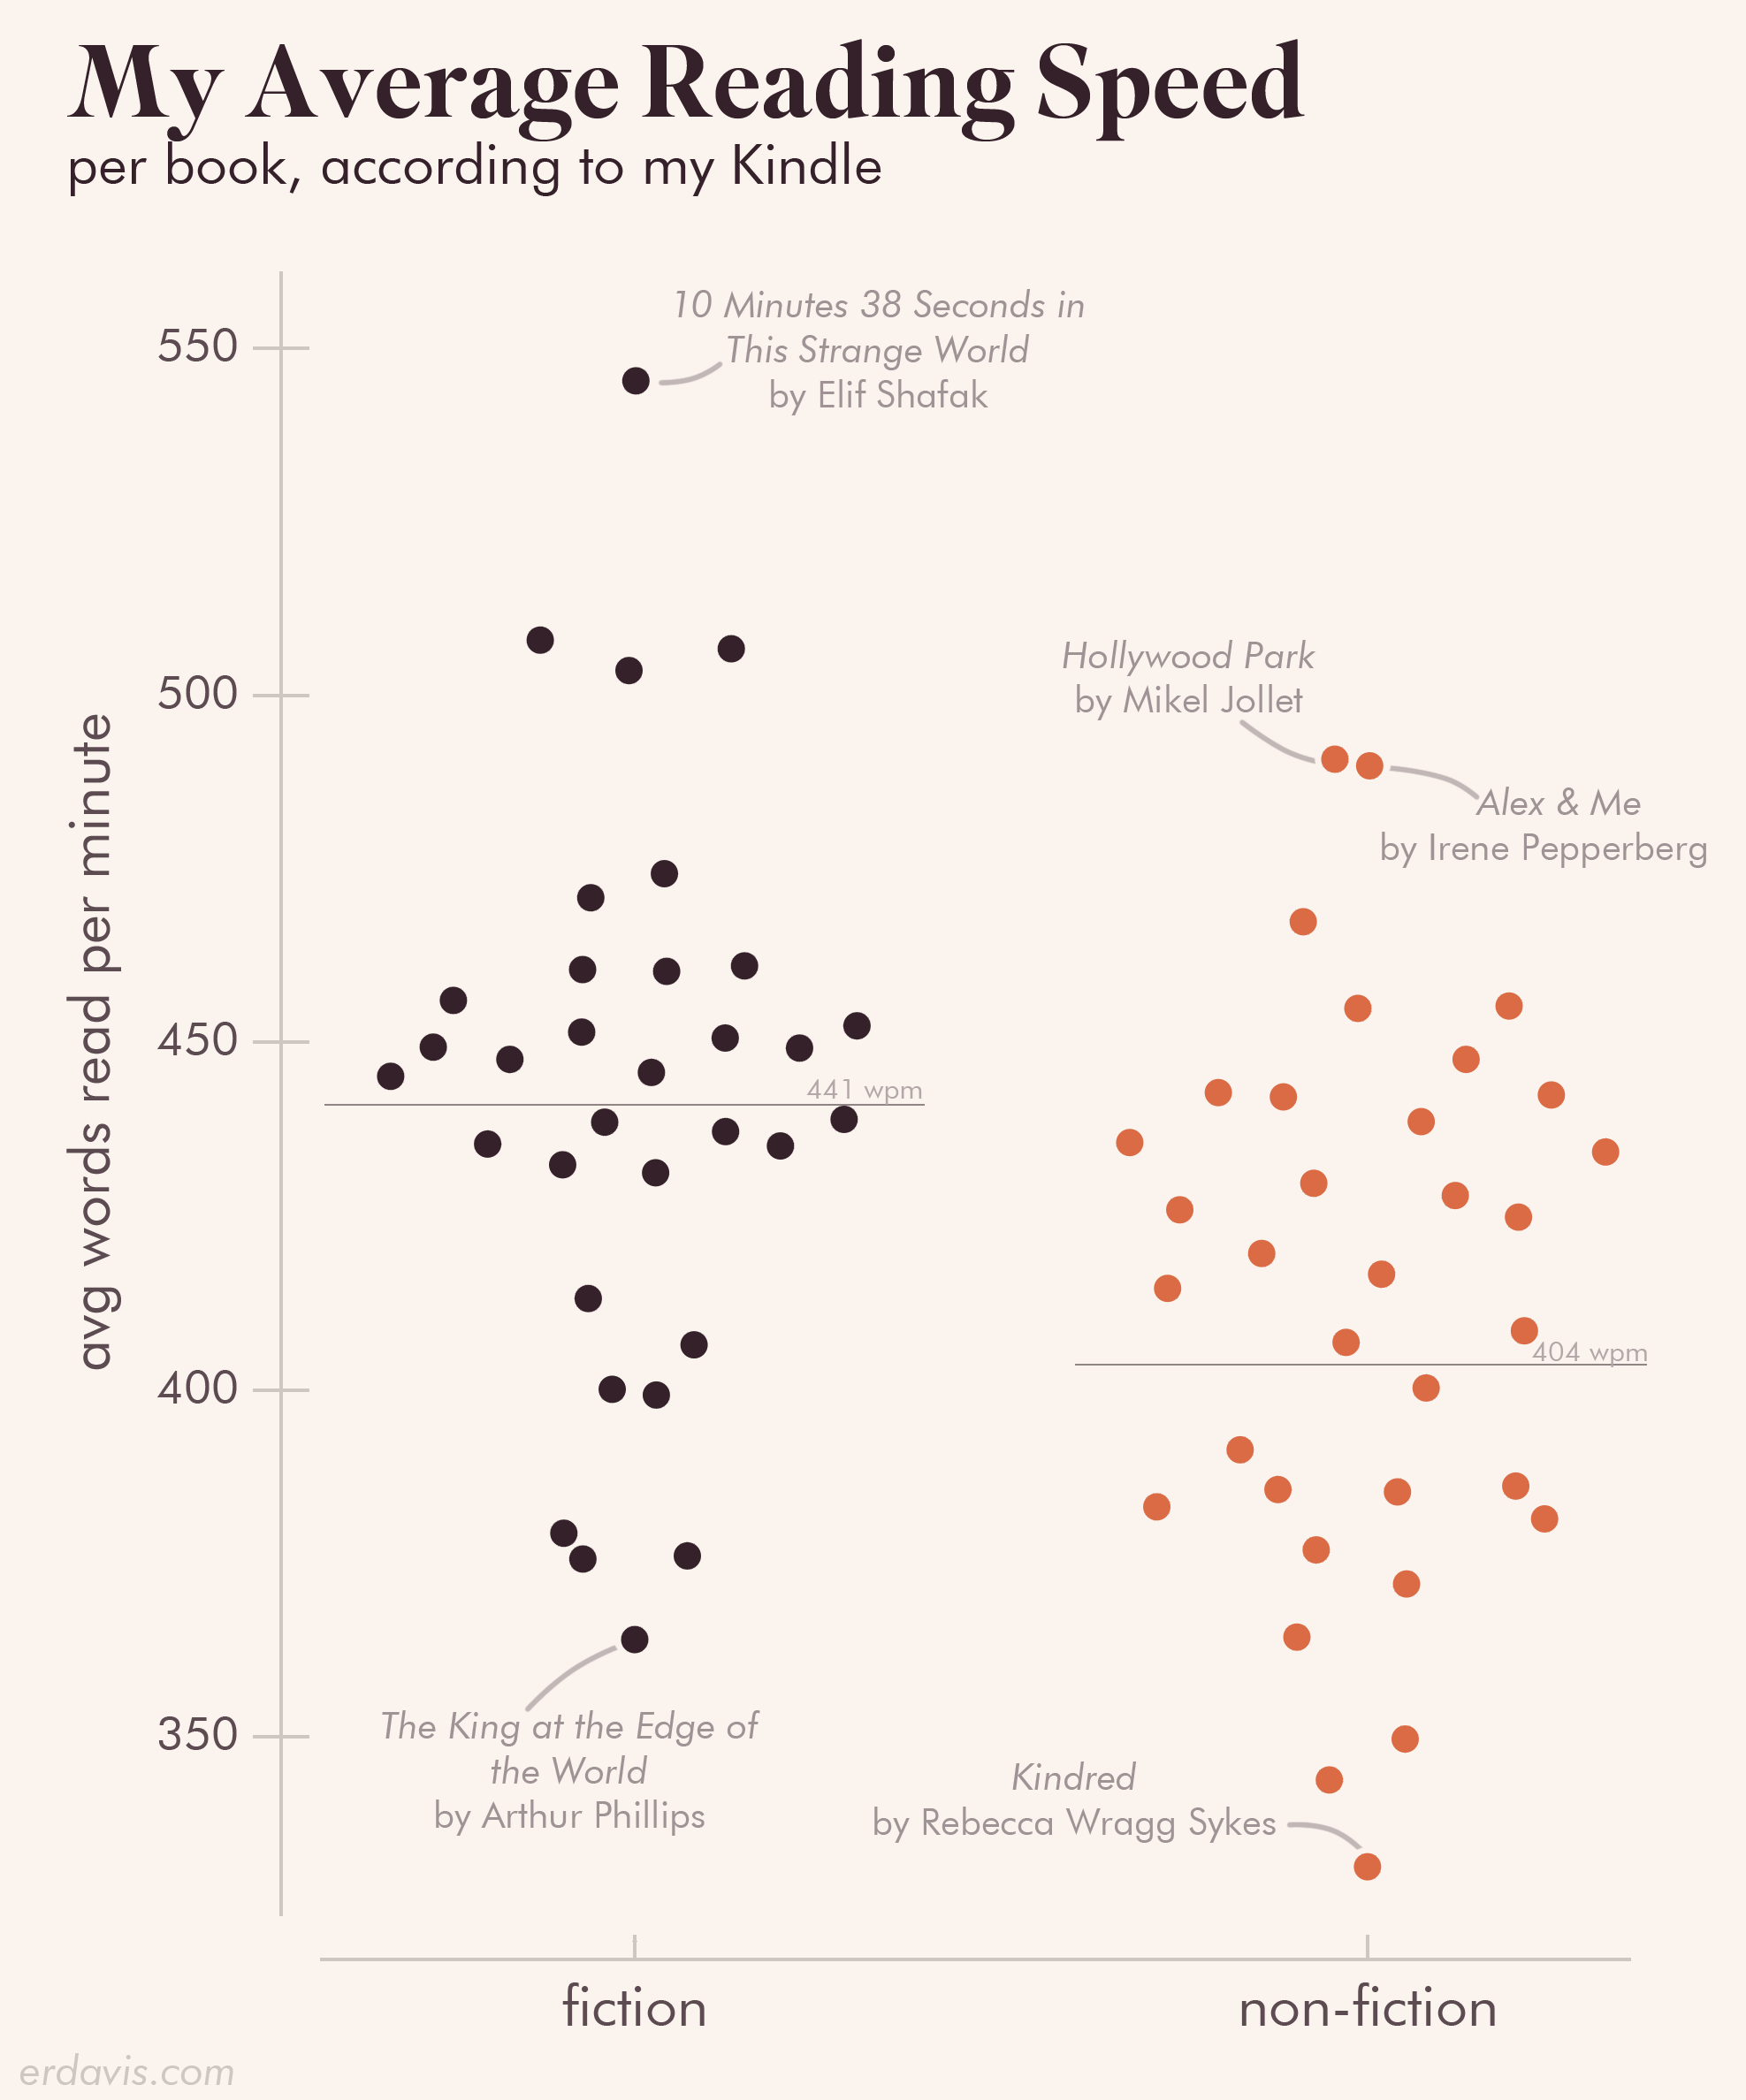
How fast did I read?
Yes, it’s nerd bragging points, but I was curious!
I had the distinct feeling that I read nonfiction slower than I read fiction, and the difference is indeed apparent in the data.
What isn’t apparent, though, is why there is such variation between individual books.
Sometimes I know the answer: the book I read the slowest, Kindred, is very information dense. It’s a very interesting overview of the Neanderthals, but some of its chapters were downright tedious. I also read it during a very stressful period where I was feeling my lowest and struggled to pay attention to much of anything, let alone detailed explanations of prehistoric methods of stone knapping.
Other times, I don’t. I remember reading and enjoying 10 Minutes 38 Seconds in This Strange World, but I definitely don’t recall zipping through it at an incredible rate. I do have to wonder if there might be a flaw in the Kindle data collection, but there isn’t an easy way to check.
So how can you gather this data?
Welp, it’s a pain in the butt. It’s absolutely doable, but you need to be careful and committed to making it work.
The data comes from two places. I joined data from both these places to make my final visualizations. Freetime has words and time read data. The annotation logs have start and stop positions for each of your reading sessions.
Kindle Annotation Logs
The Kindle automatically logs your reading activity for each session, but wipes this data whenever you connect to WiFi.
Step 1
Always make sure your WiFi is off!
Step 2
When you hit a point that you need to turn it on (say, to download more books), you’ll need to extract the annotation logs from your Kindle and save them elsewhere.
First, exit Freetime (3 dots in top right, Exit Freetime). Next, connect your Kindle to your computer via USB.
If the Kindle is in Freetime mode, the computer won’t register it when you plug it in.
Step 3
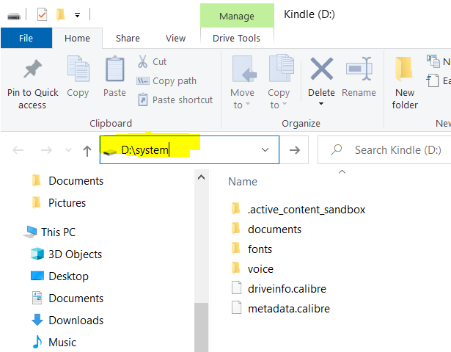
Once your Kindle is connected, a file dialog should pop up. Go to the system folder–for me, it’s hidden, but I can still reach it by typing it manually into the navigation bar
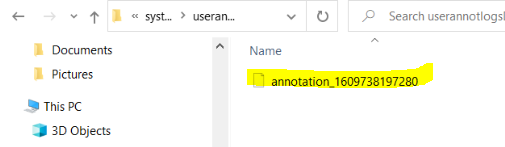
Once in system, open the subfolder userannotlogsDir. There should be a single file hanging out in there. Copy it over to your computer and save it somewhere safe. Again, once your WiFi goes on that file will be gone from your Kindle.
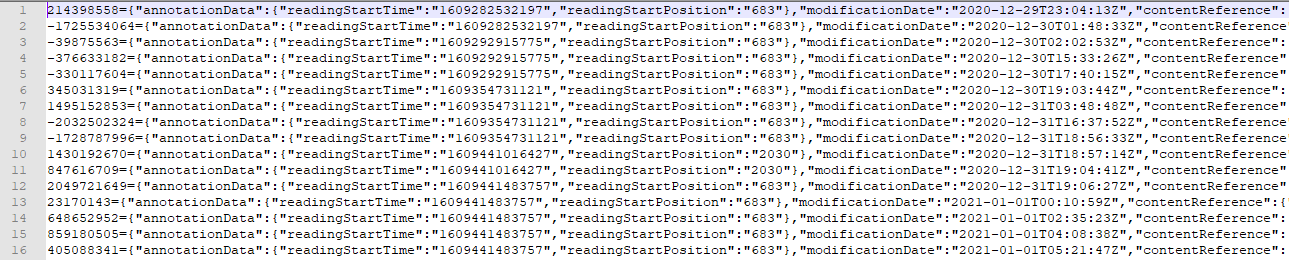
This annotation file contains JSON detailing each of your reading sessions, and since this isn’t a technical tutorial you can parse it how you like!
Kindle Freetime
Kindle Freetime is a feature meant to be used by parents to limit what media they have access too. Handily, however, it also tracks the child’s reading: how long, how much, and which books.
Step 1
You’ll want to set up for a Kindle Freetime account for yourself. I believe it costs $4/month. Unfortunately, I first did this back 2018 and no longer remember how I did it–but I’m Google knows.
If you’re asked for a Freetime password, make it really simple. Mine was just one letter. It’s intended to prevent children from exiting Freetime, so if this is just for yourself you don’t need that protection.
Step 2
Next, you’ll want to add media to your Freetime account. You can only add items from the Amazon store, unfortunately, no uploaded epubs or pdfs. I get almost all my books from the library, though, so this limit was okay with me.
To do this, sign into your Amazon account, click Account & Lists in the top right corner, and pick Content & Devices.
In Content & Devices, find the book you want to add to Freetime. Click on the 3 dots next to it and select Manage Family Library, then Add To Library.
The next time you turn on WiFi, your book will be available.
Step 3
Do all your reading in the Kindle Freetime environment.
To do this in on my Paperwhite, I click the three dots in top right corner, then select Amazon Freetime. You’ll see a list of your registered children–just pick the right one and click Start.
Step 4
To extract the Freetime data, connect your Kindle and navigate to the system folder as described above.
Go to the Freetime folder and you’ll see a SQLite database called freetime.db. This doesn’t get overwritten when WiFi is on, so you don’t need to back it up. I just copied it over to my computer once, at the end of the year.
Within freetime are a variety of tables. I personally used bookinfo (info on the total # of locations within each book), bookmeta (book metadata, like title and author), and dayinfo (data on the amount you read each day).
Again, not a technical tutorial so I won’t get into how exactly to extract this data, but it’s easily Googleable.
In summary
Always do your reading in Freetime. Before you connect to WiFi, remember to extract your annotation log files.
It’s an incredible annoyance that Amazon doesn’t make this any easier. I think Kindle owners would love to see their reading stats–it makes no sense to me that that feature is only available on Freetime.
But, hey, I’m still doing this to see what my 2021 in reading will look like…
Discover more from Data Stuff
Subscribe to get the latest posts sent to your email.
This was so much fun to read and had my brain zipping, wondering how my stats on speed and time of day would compare!
Also, I found it really interesting that we read many of the same books this year. And on the point of Tyll… I read that one with so much anticipation and was so disappointed–I felt like I had to drag myself through it. Clearly, I missed something, if it was one of your favorites!
I would absolutely love to see someone else’s reading habit stats, especially for the first two charts! Tyll was great, but I do have a fondness for unnerving jesters (have you read Darkmans by Nikola Barker? highly recommended)
Fantastic visualization, the tall timeline reminds me of the French train schedule that Edward Tufte put on the cover of Visual Display of Quantitative Information. (Given your passion for DataViz, I can’t imagine you aren’t already familiar with Tufte!) I would constructively suggest the vertical line segments be deemphasized somehow (lighter? thinner? dotted?), but still it’s really cool!
[…] If you’d like to know how I did this or to view my data from 2020, check out this post. […]