A few months ago, I wrapped up a freelance project that made heavy use of the USDA Quick Stats data. It’s a super neat compilation of agricultural data that was begging to be made into nicer maps than the source site provides.
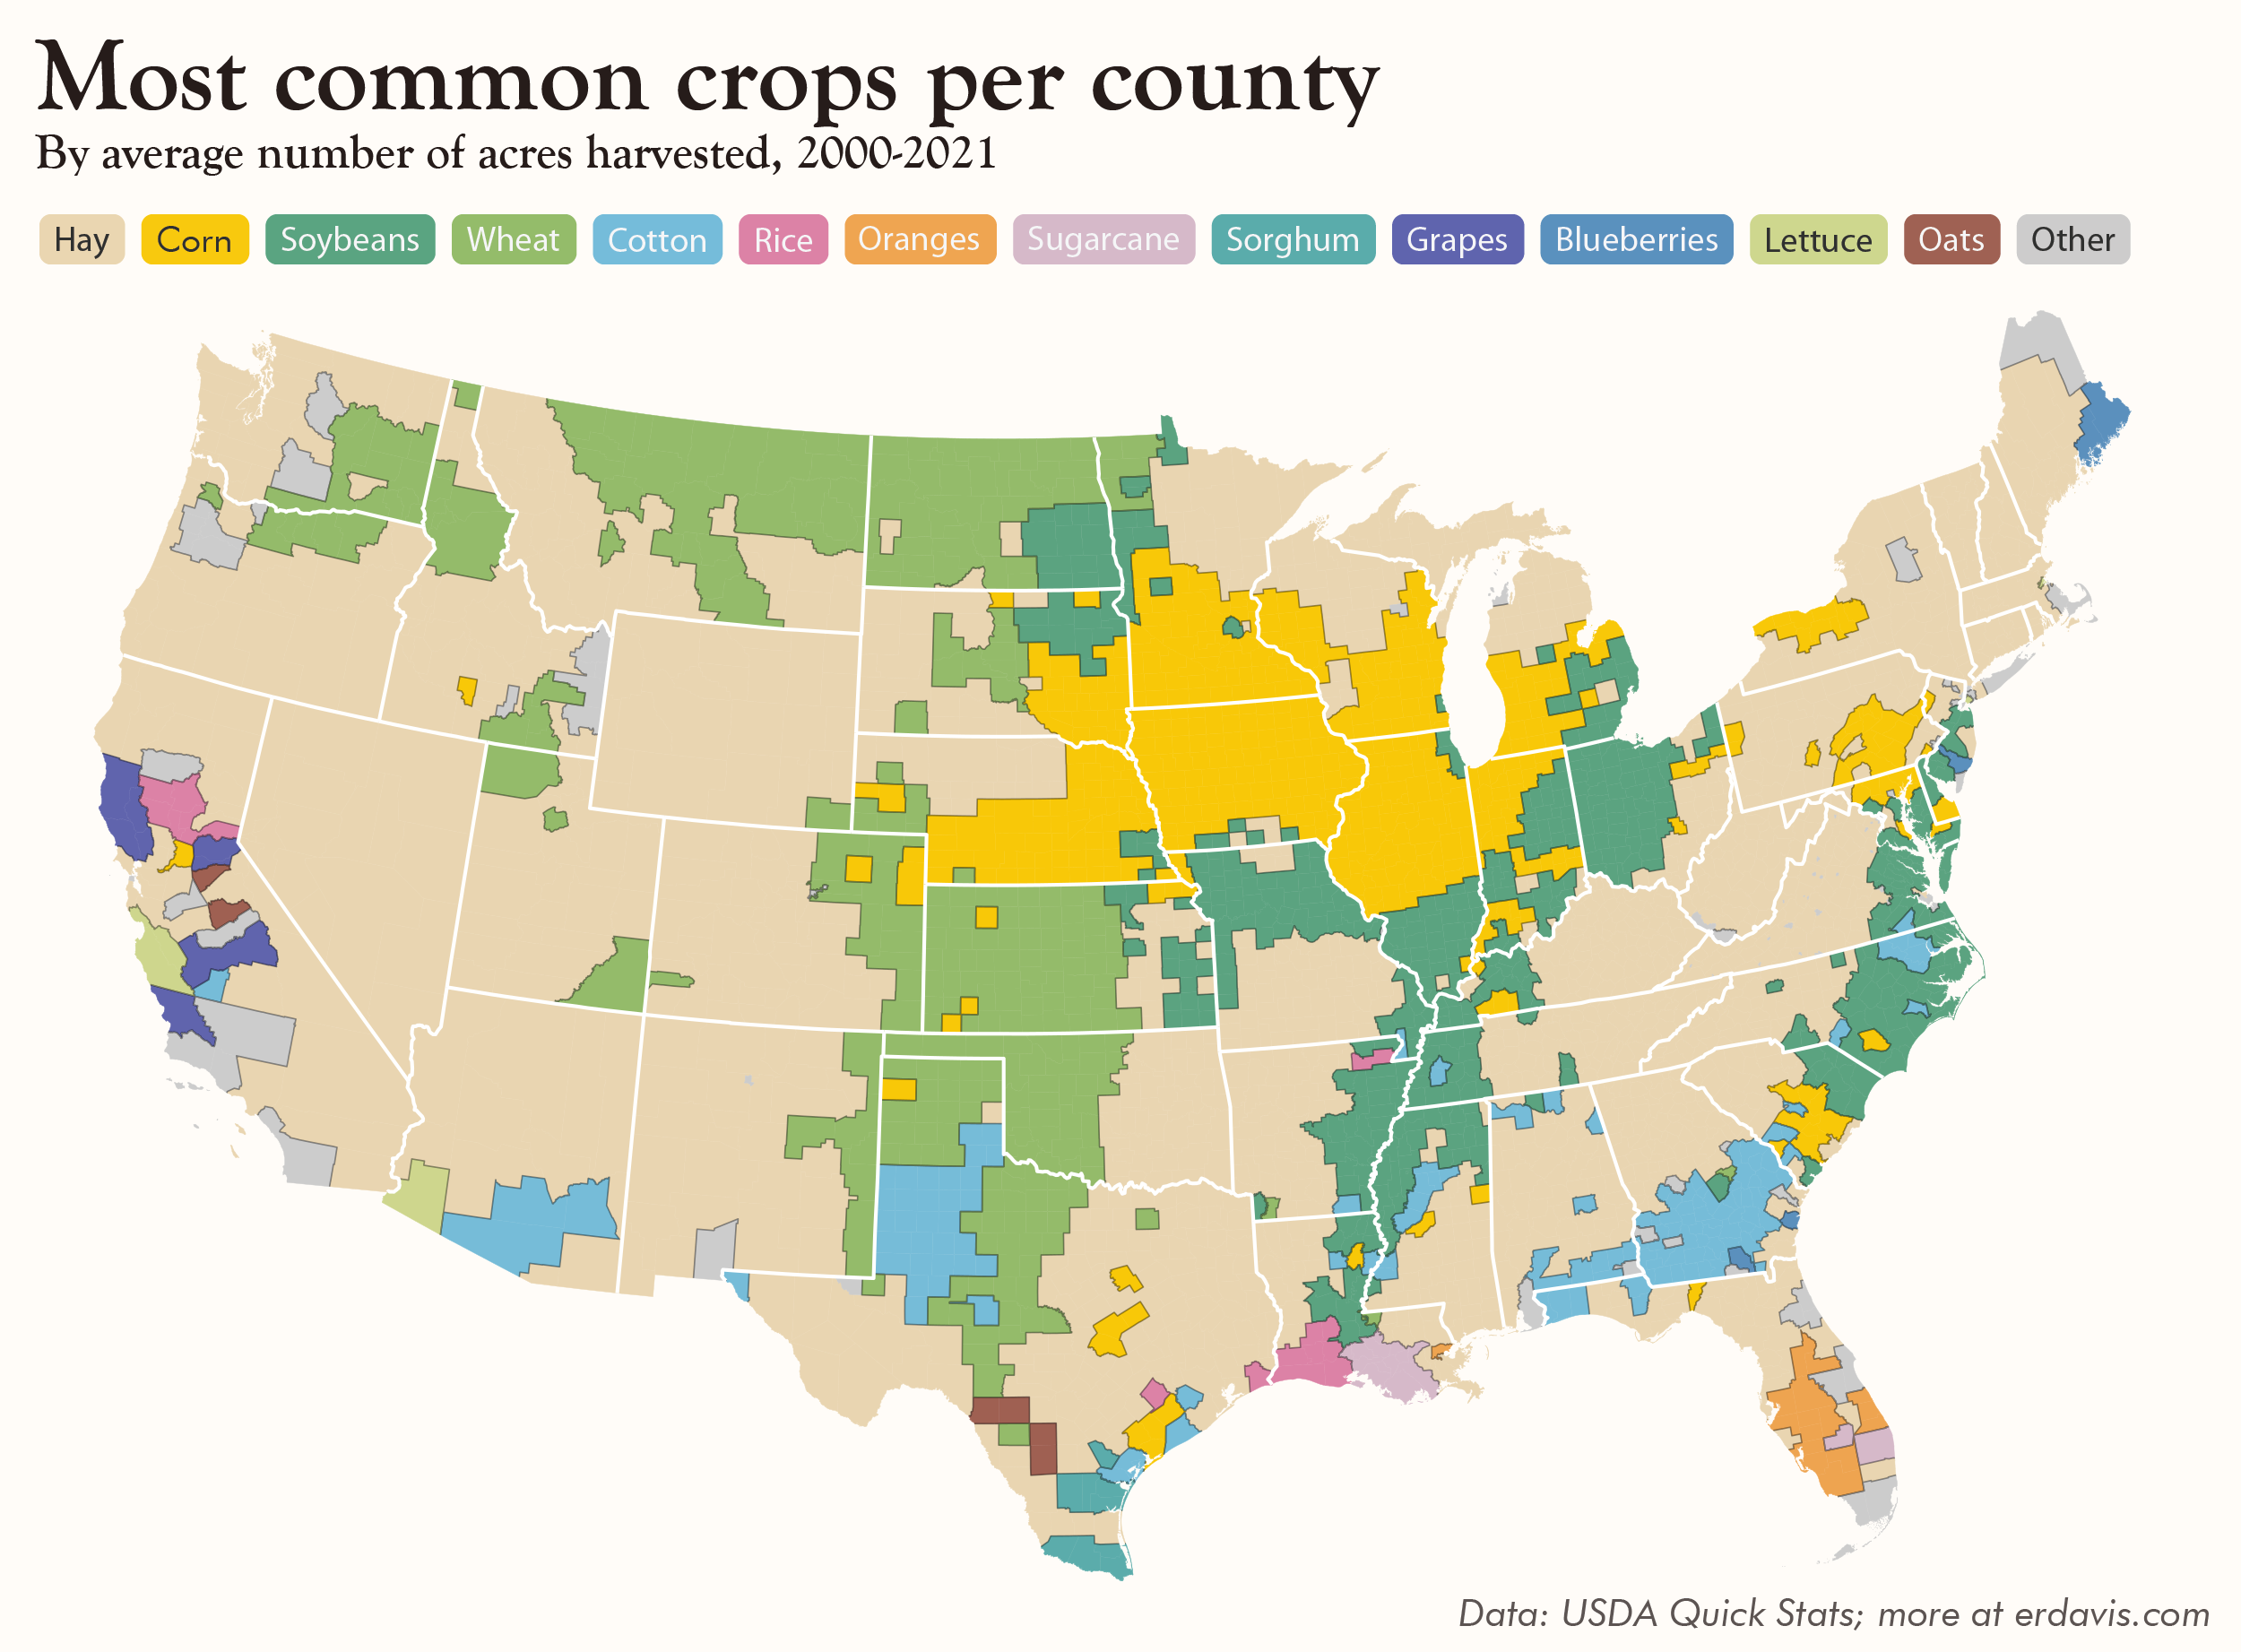
I was immediately interested in finding out where specific crops were grown across the USA. In particular, I wanted to know what the most common crop was in each county.
The answer, of course, depends on how you define “common.” After browsing the data, I decided that “acres harvested” would work best for my purposes for a couple of reasons:
- It was available for a large number of crops, whereas other values, like “amount harvested” were not
- It was standard across all crop types. One acre is one acre, but a bushel is not easily translated into pounds, for example.
- It reflects the physical reality of the land. These are the crops that take up the most physical space in each county, which worked well to answer my question.
And the answer is…
Hay! (Followed by corn, soybeans, and wheat)
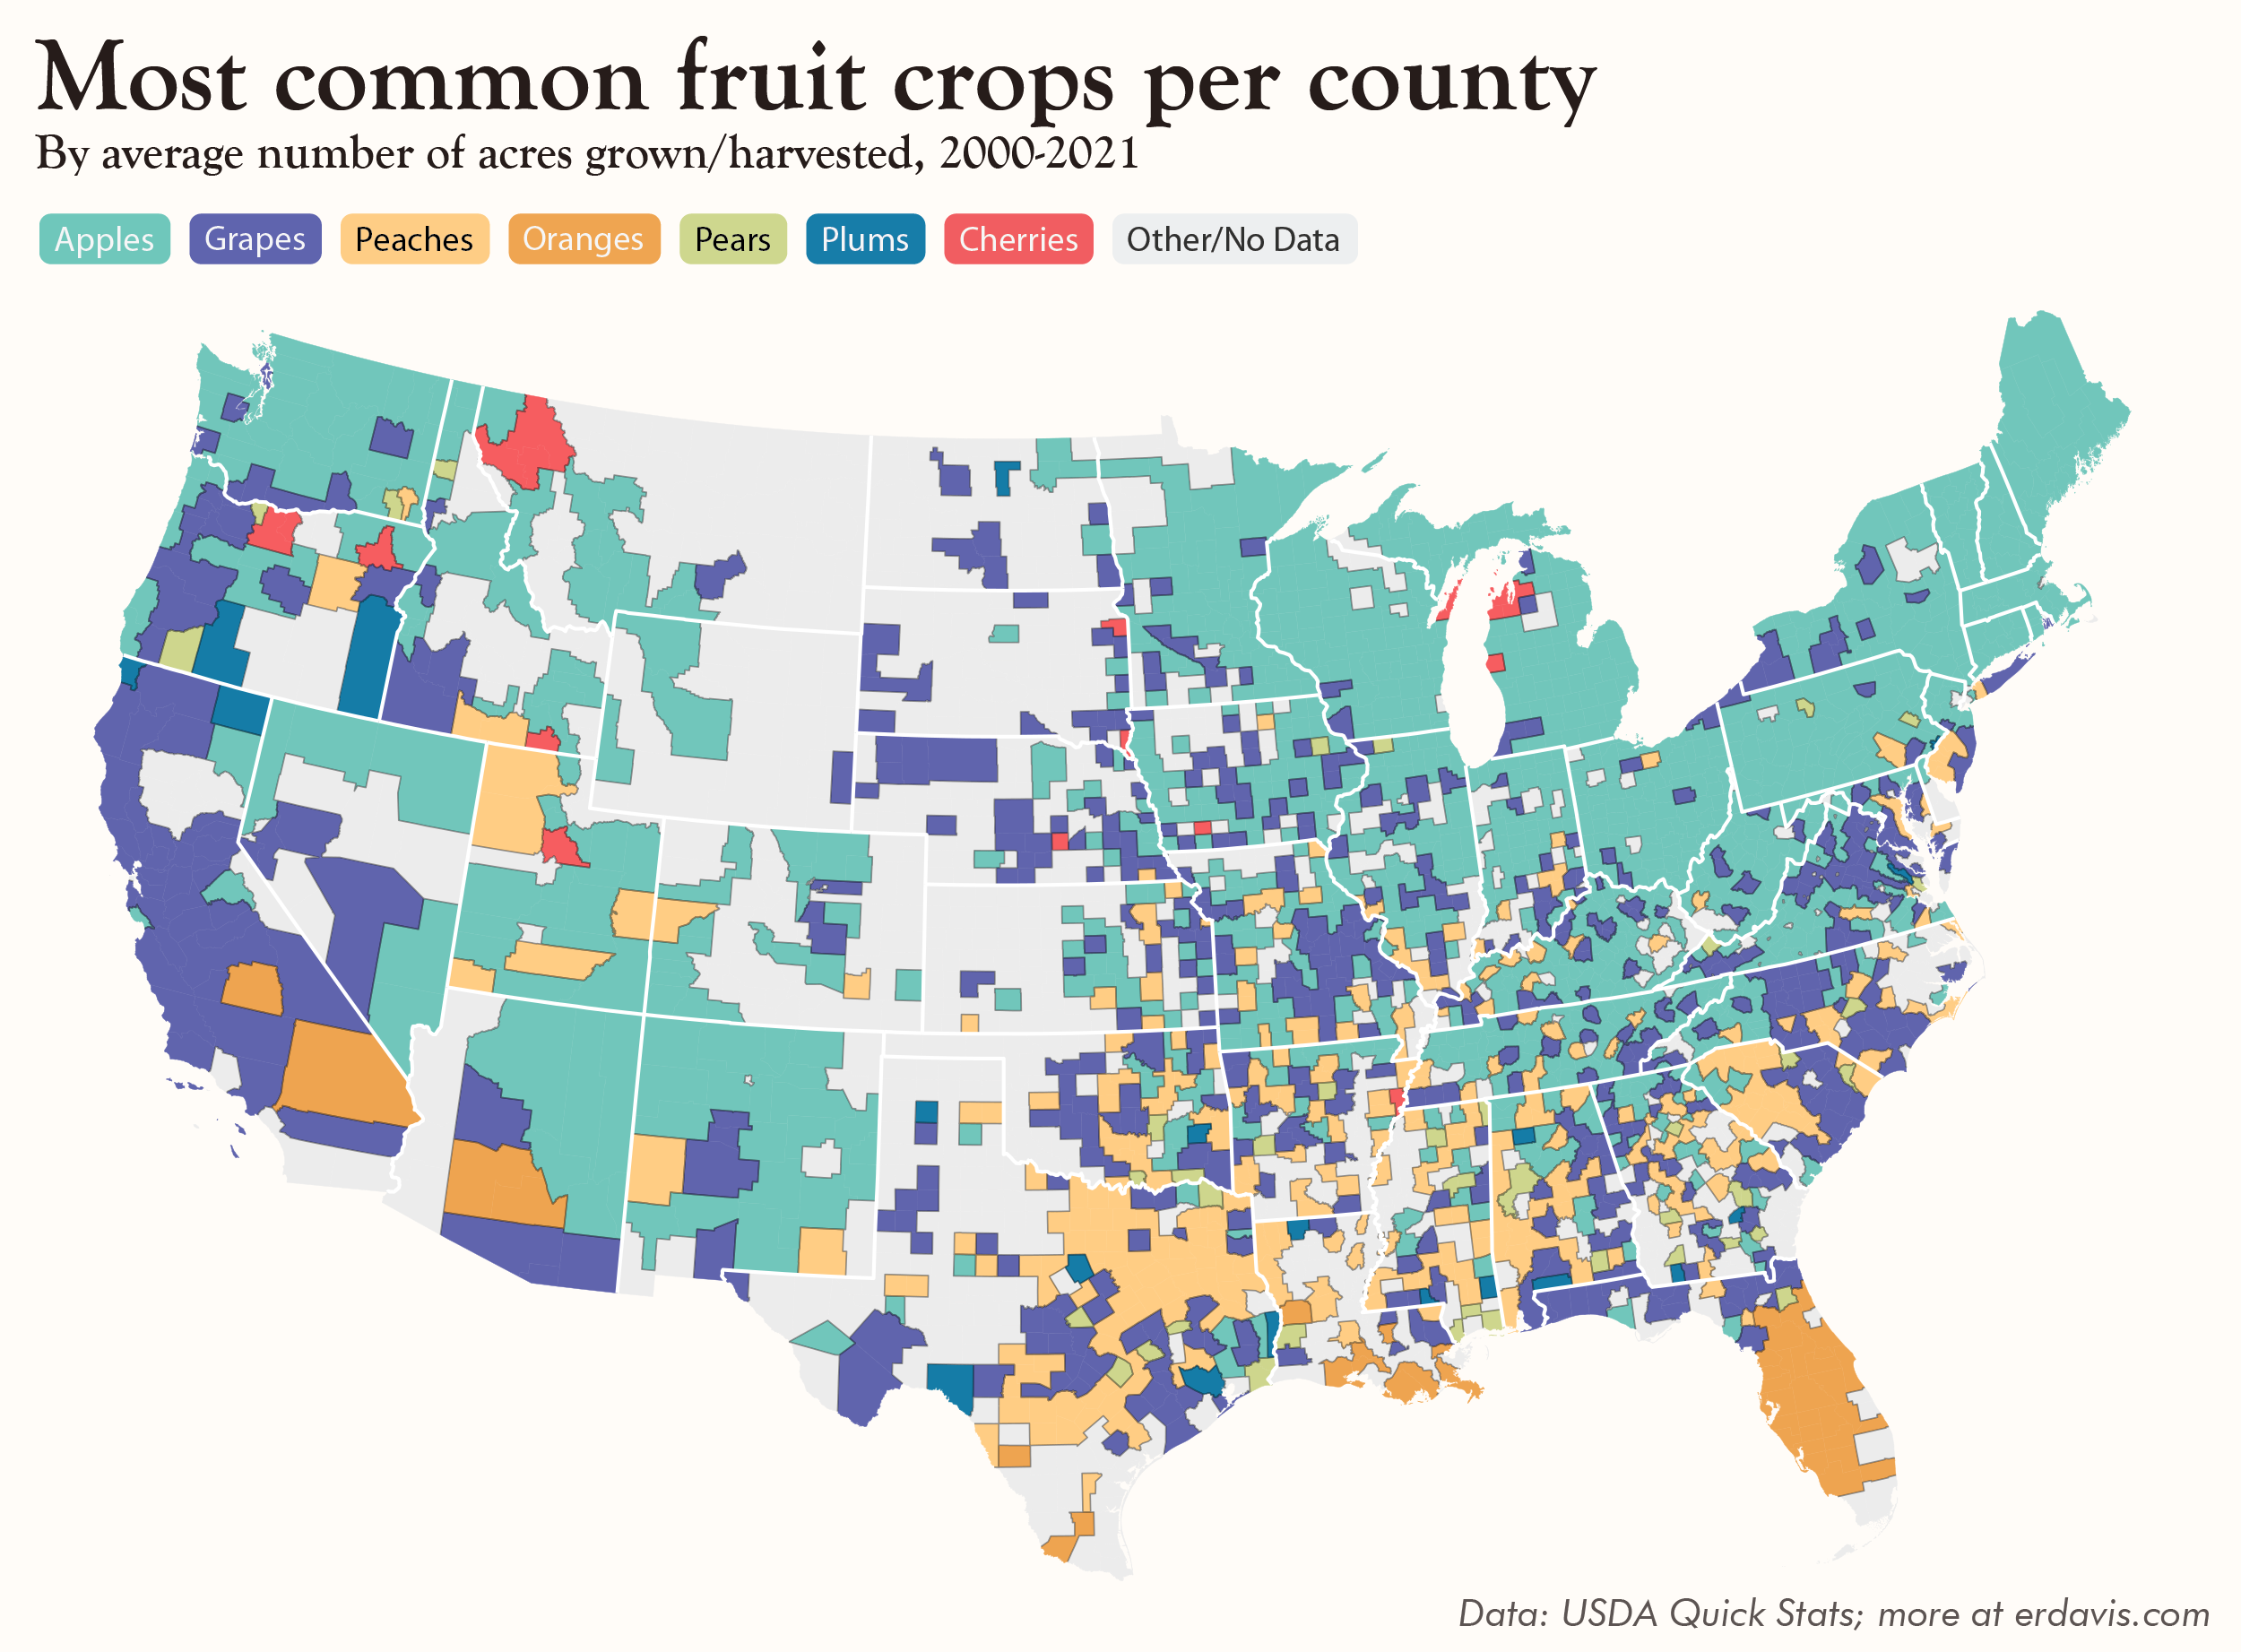
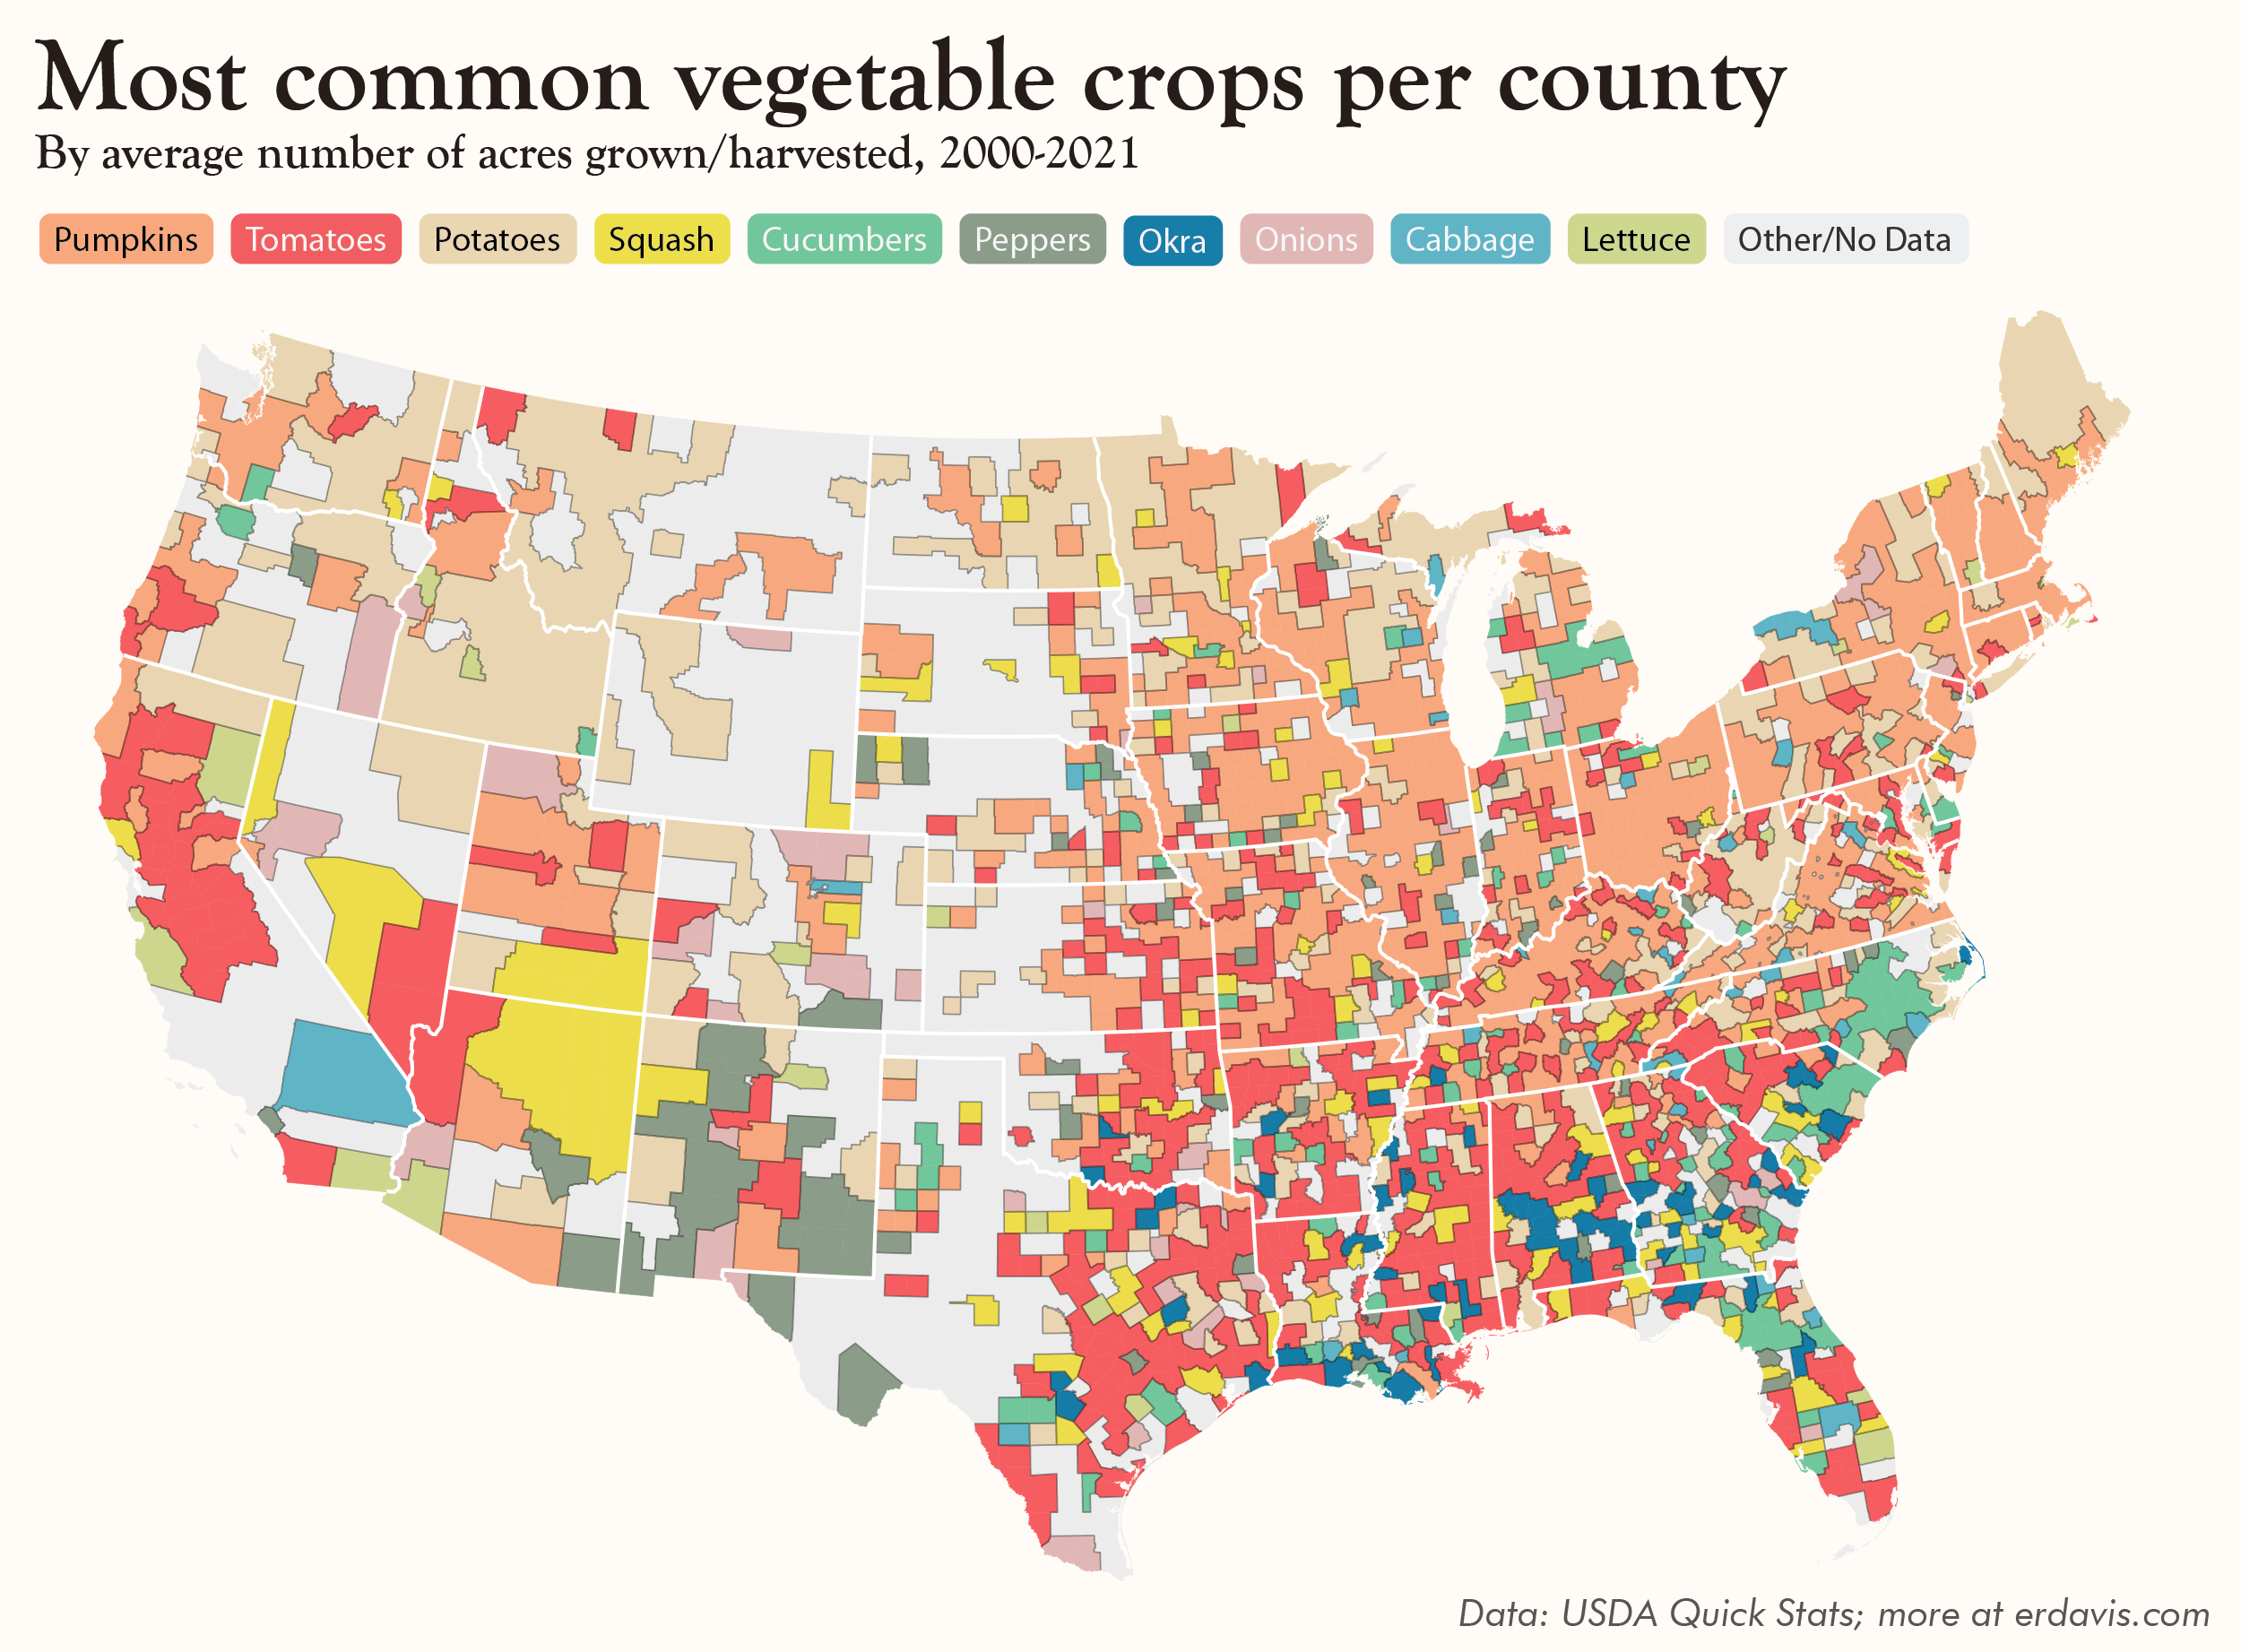
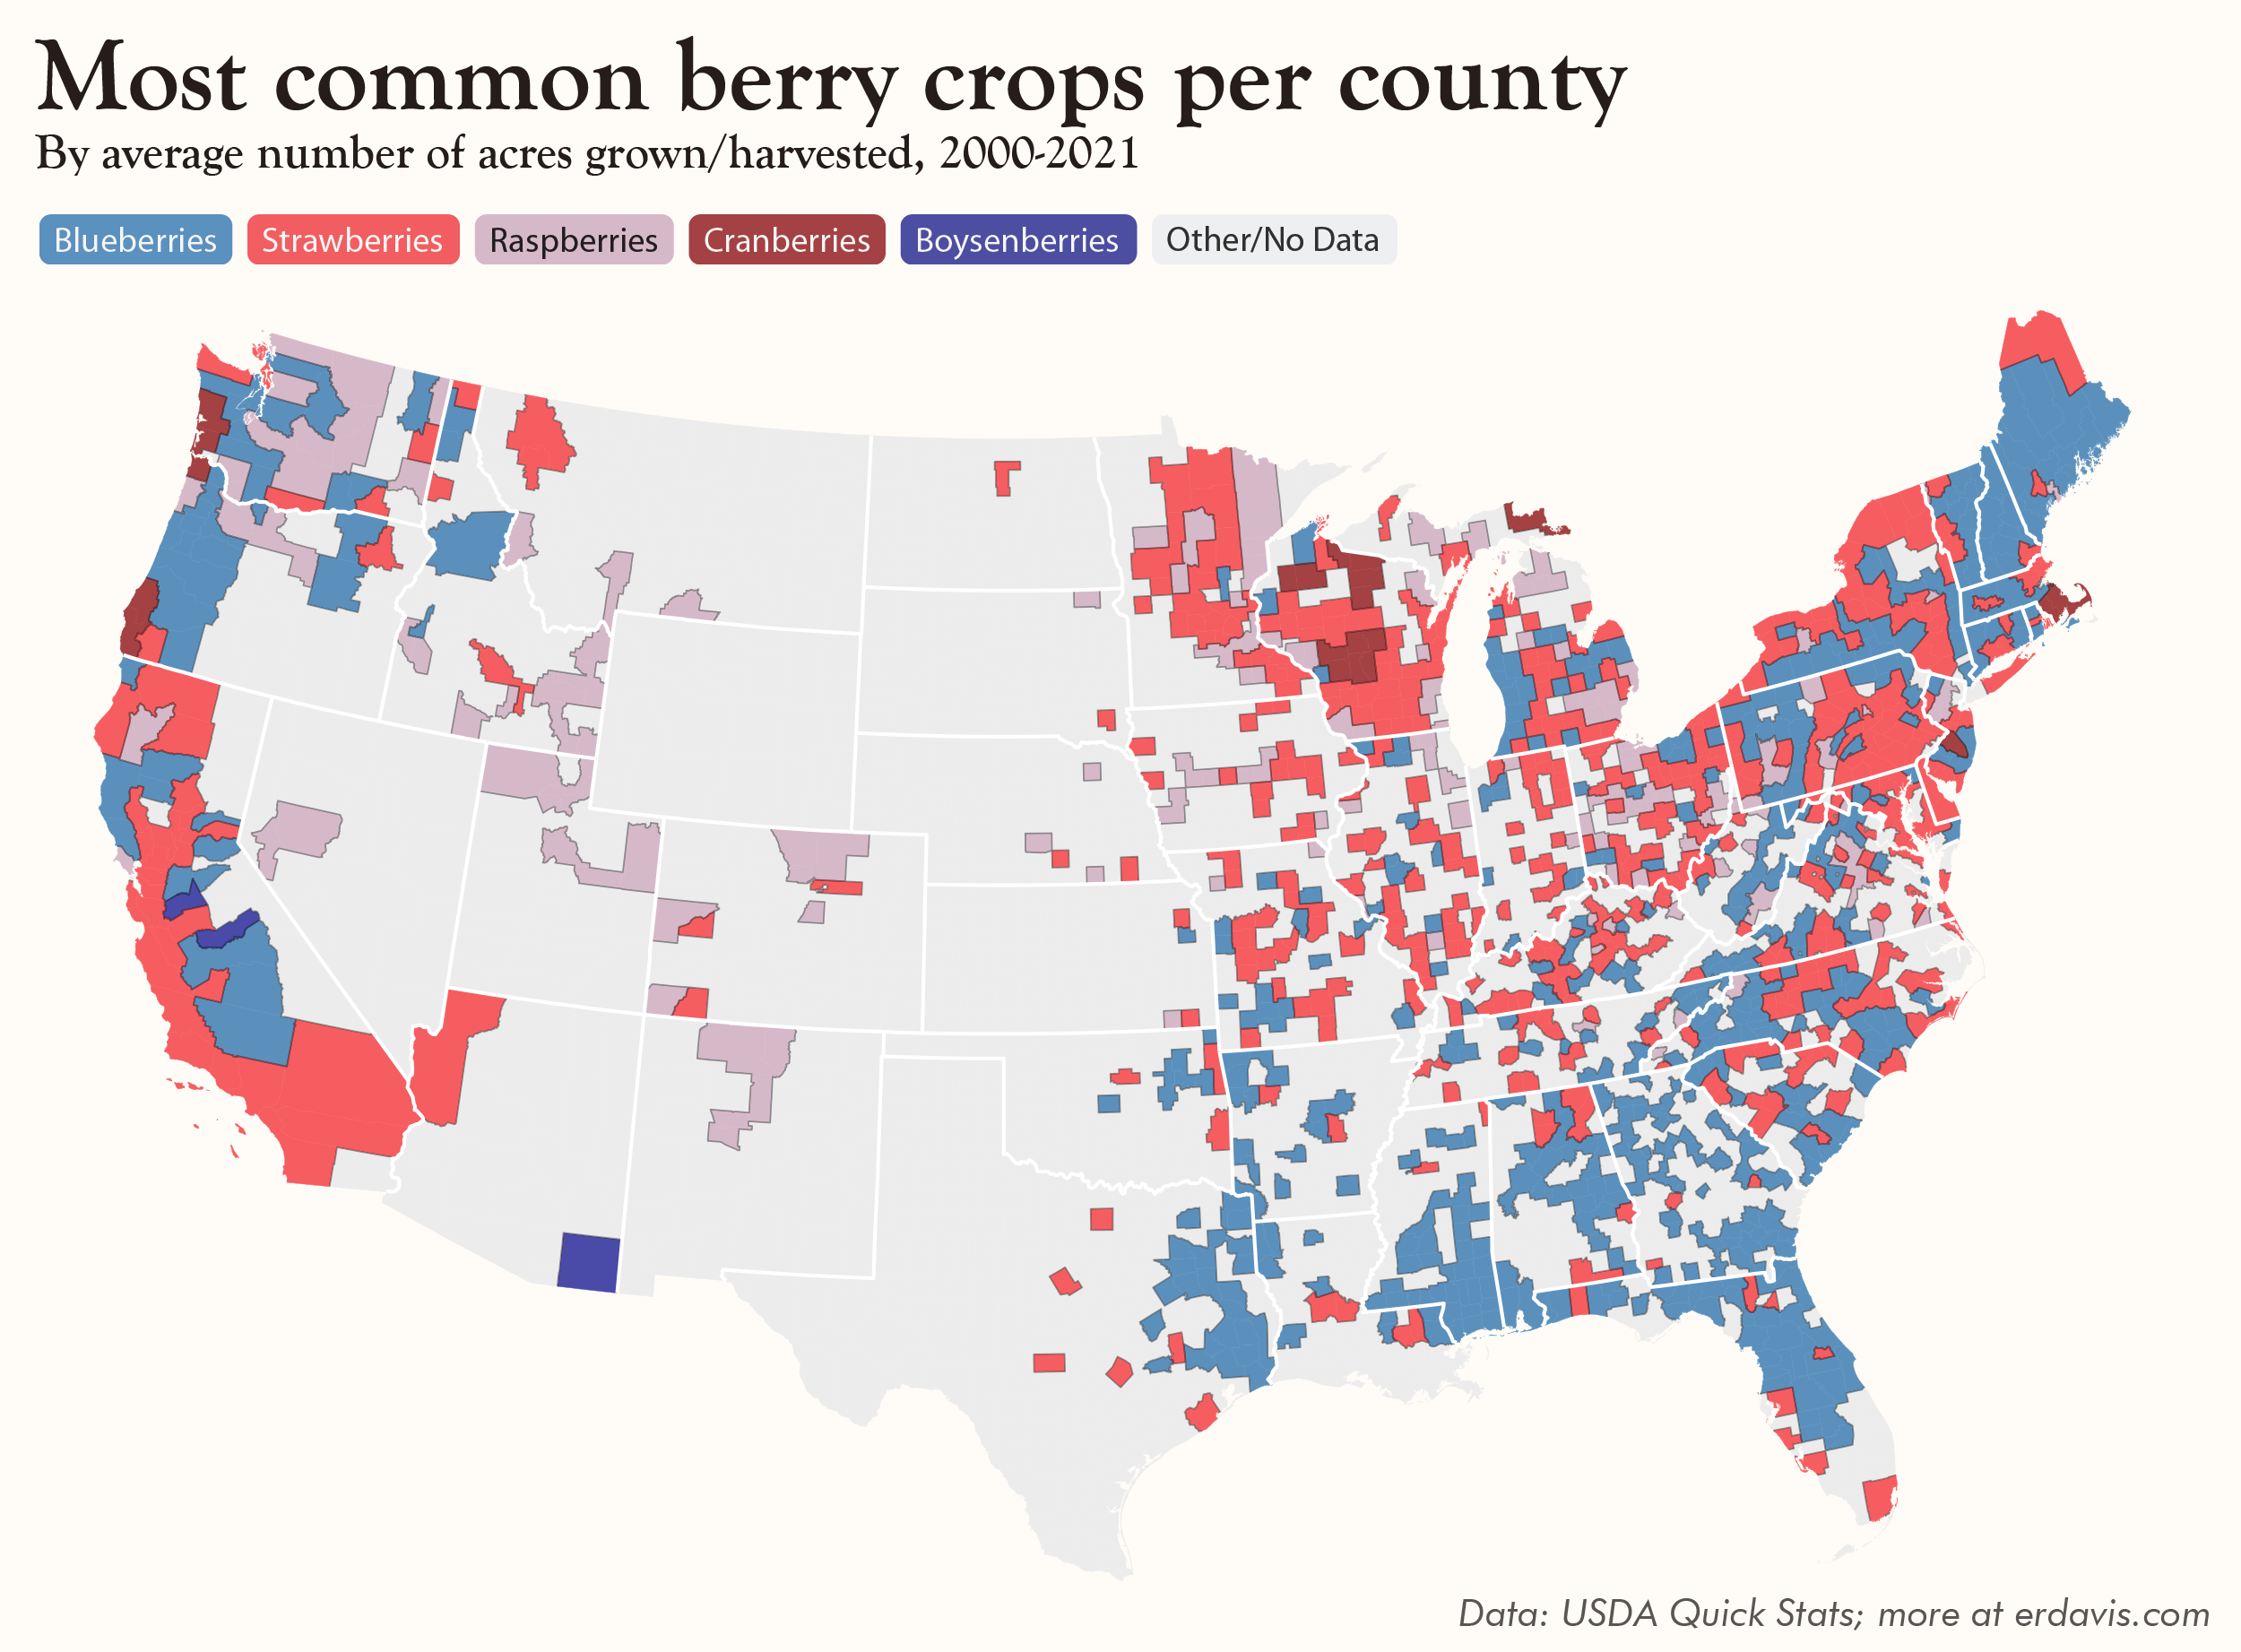
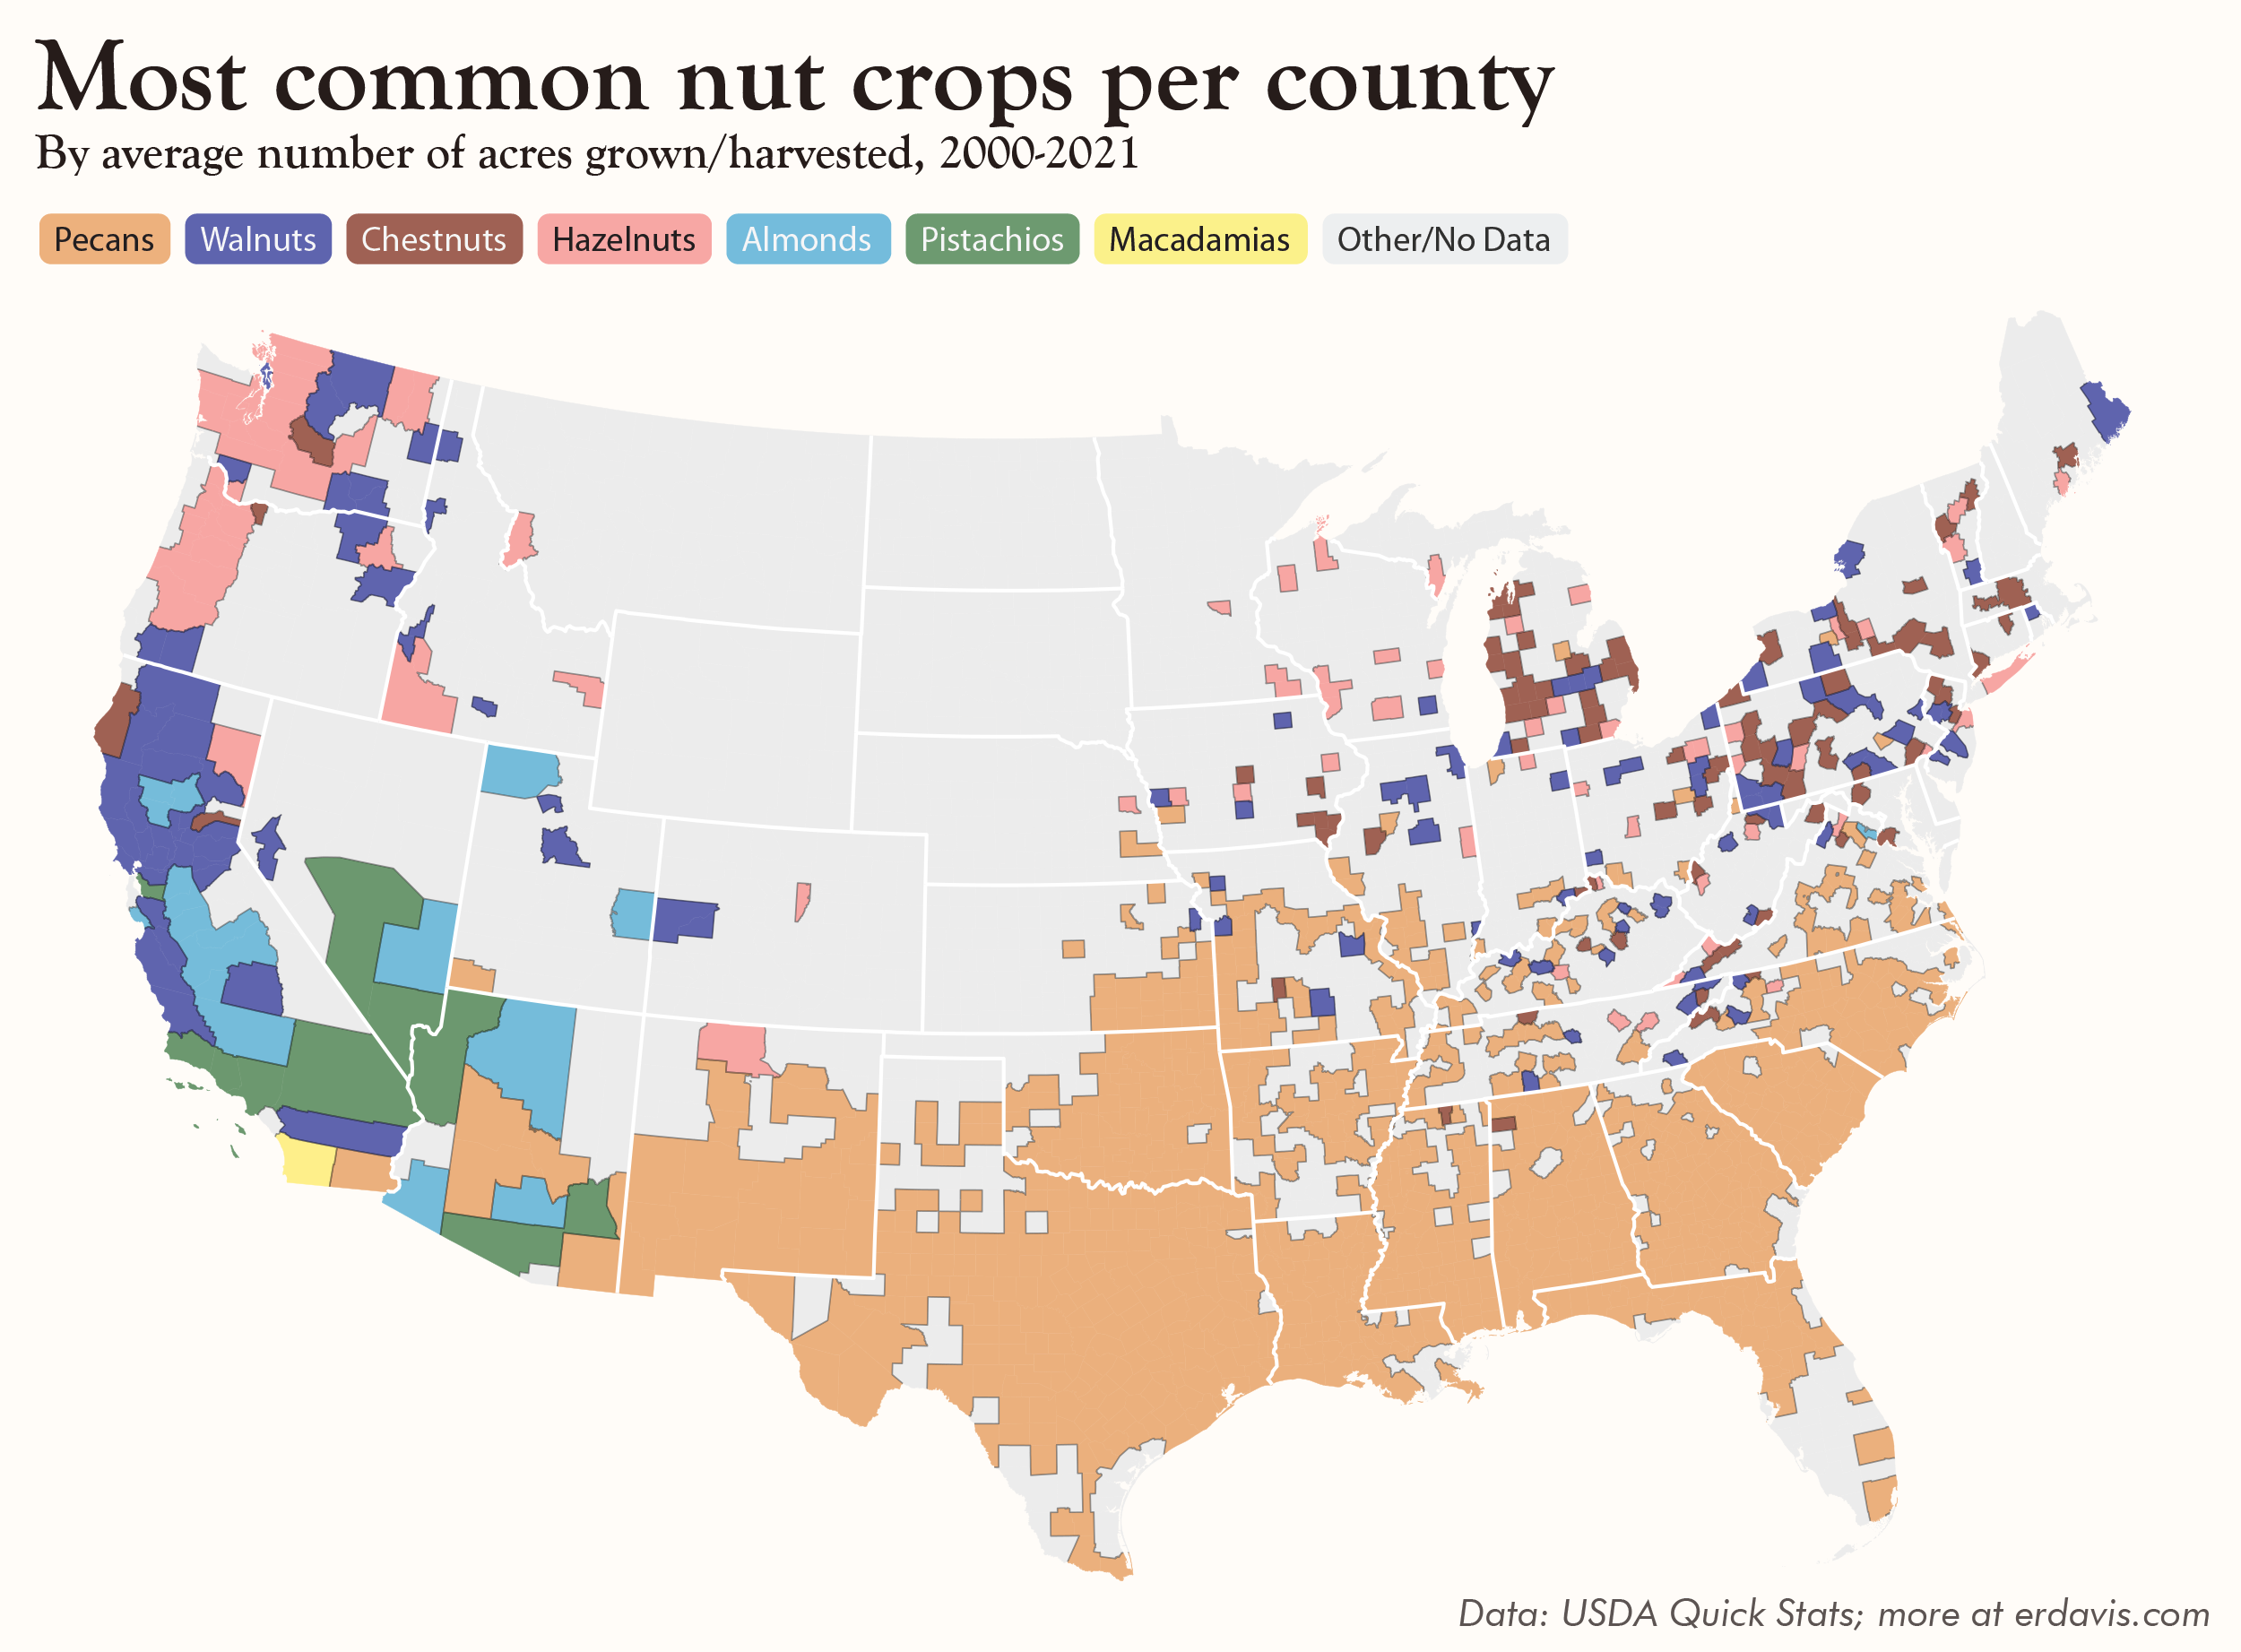
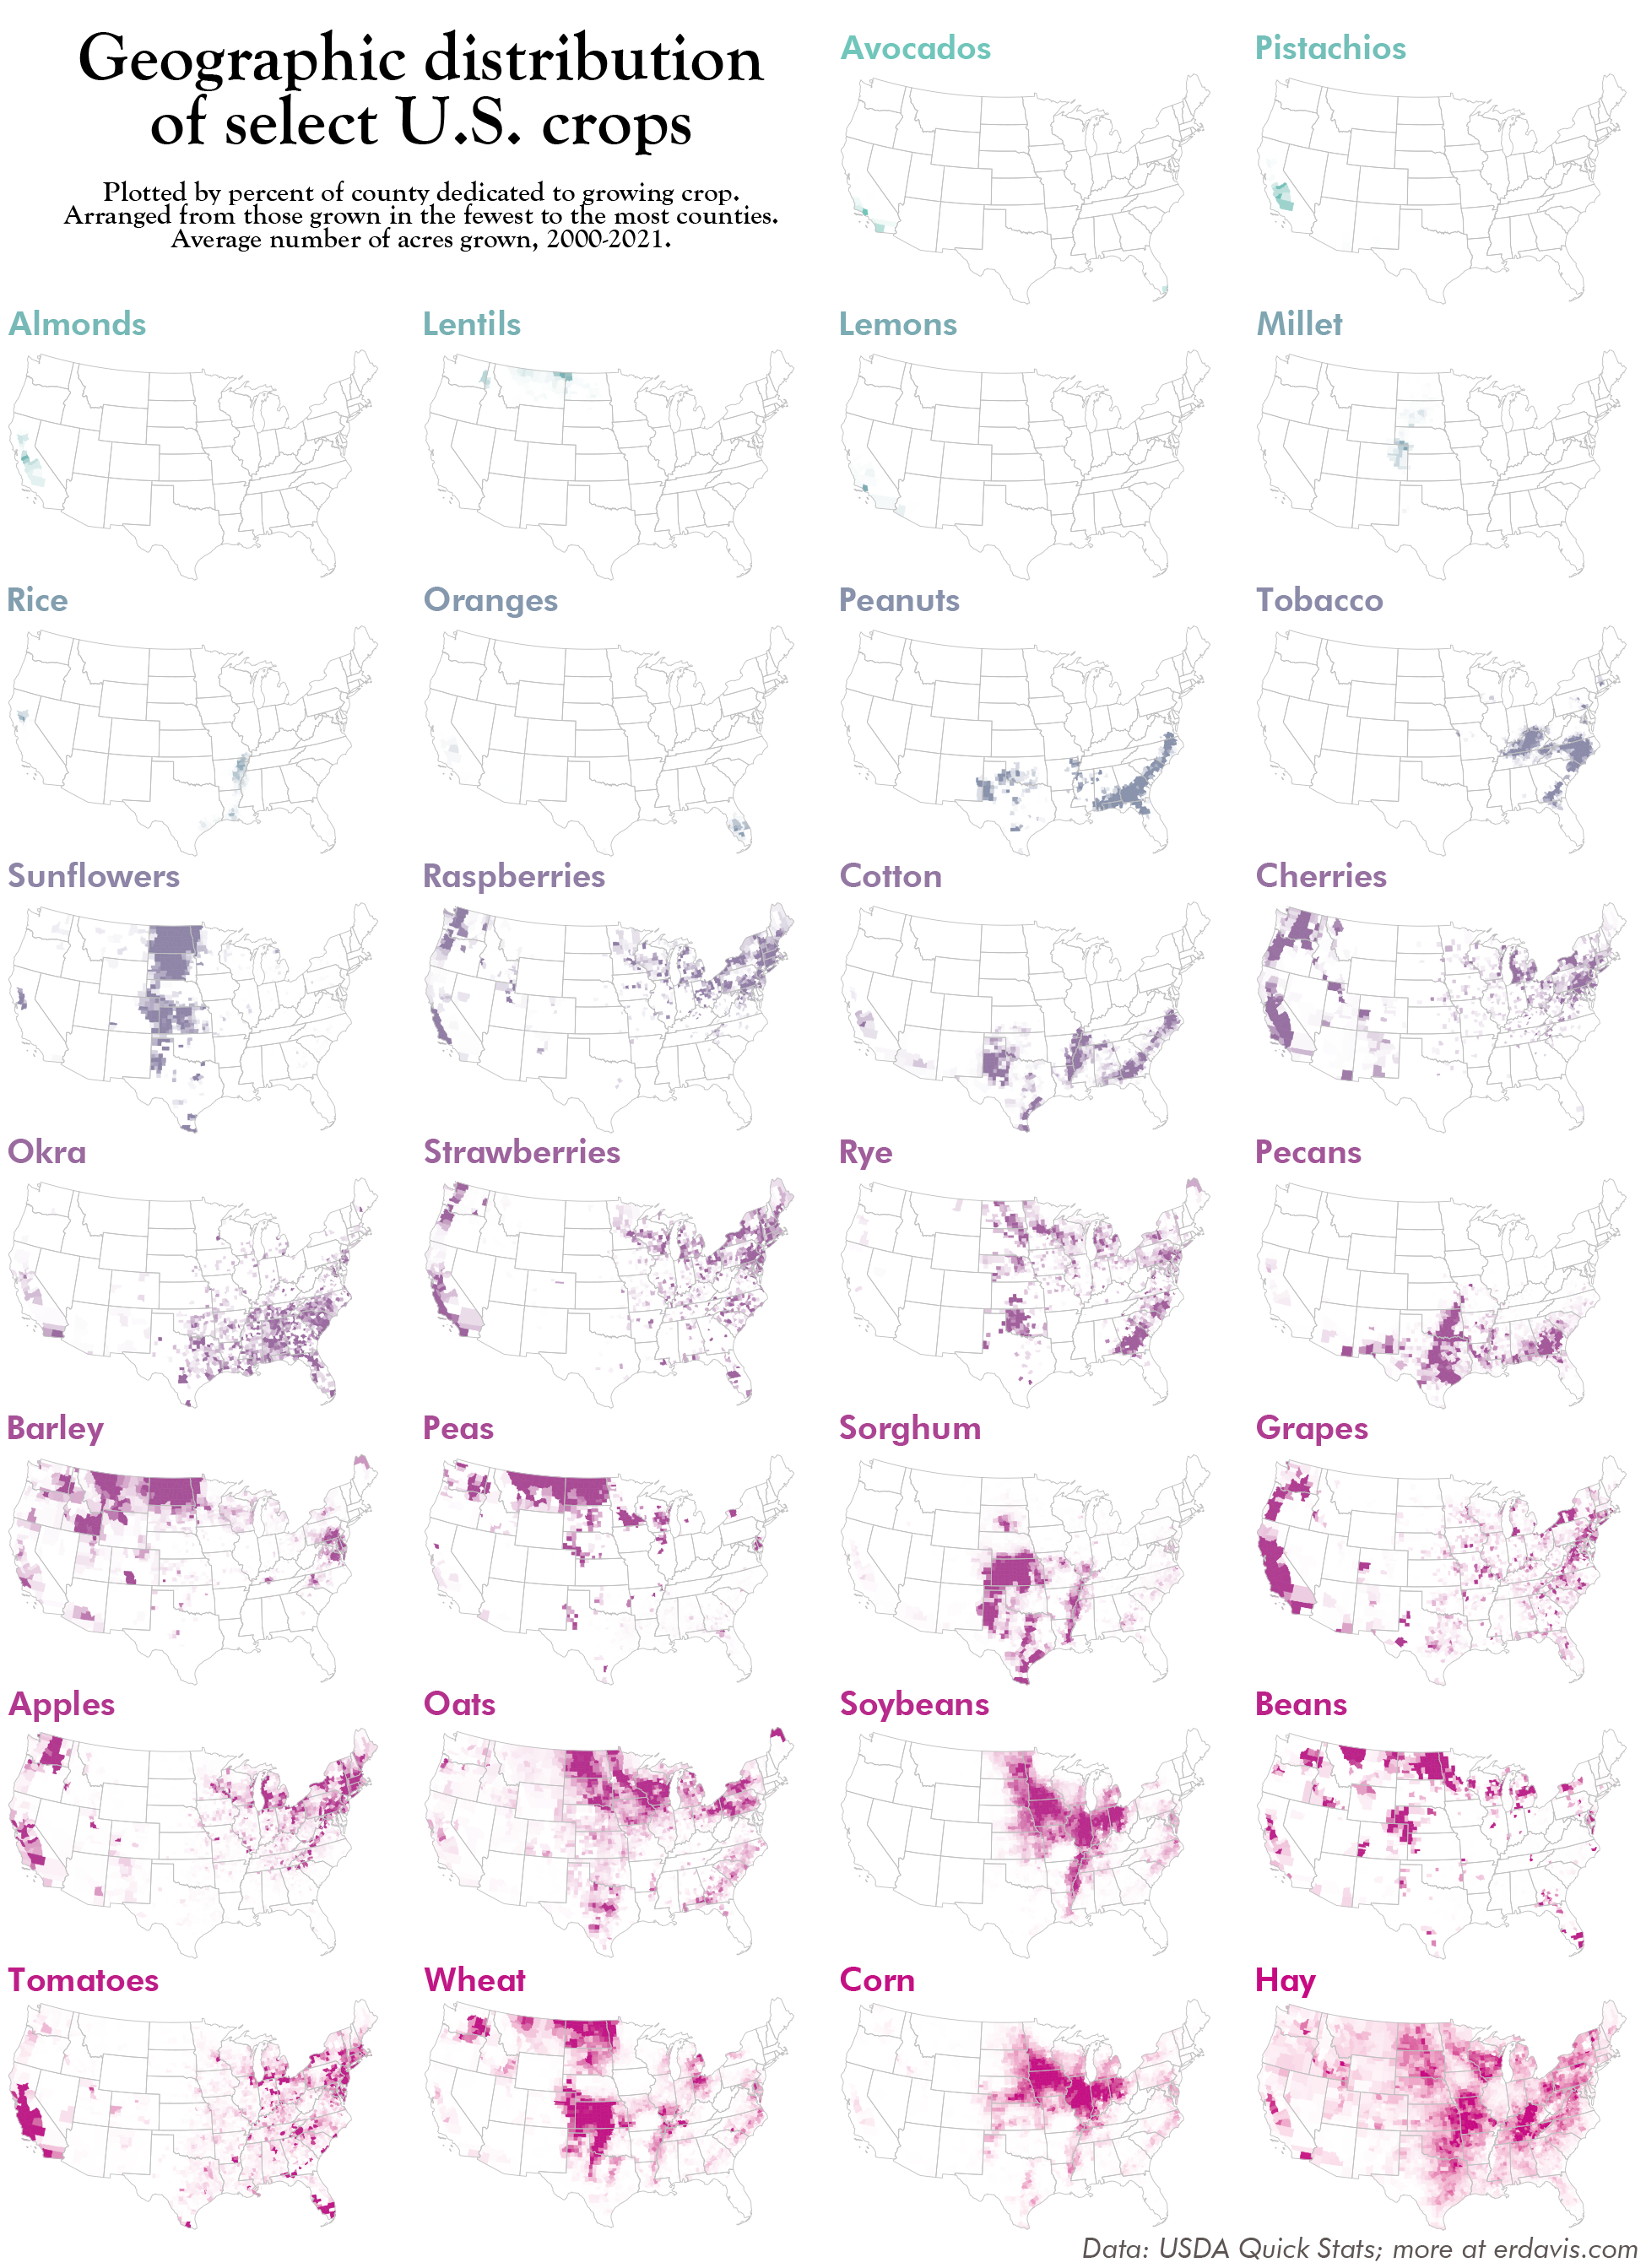
Bonus maps, from fruit to nuts
Yeah, it’s soup to nuts, but let me have my dumb pun.
Is it a character flaw that I can’t ever make just one map? Maybe, cause I never get anything done on a reasonable timeline.
But hey, enjoy these category-specific maps. They’re not necessarily good (I can hear my editor screaming that they should be bar charts), but I love them in all their busy wackiness.
But wait, there’s more!
I really can’t help myself, can I?
How I did it
Phew.
Luckily, there’s a great R wrapper for the USDA stat site: TidyUSDA. It makes getting all the data a snap.
You’ll first need to sign up for a USDA API key.
Install and load R libraries
install.packages(c('dplyr', 'ggplot2', 'tidyUSDA'))

library(dplyr)
library(ggplot2)
library(tidyUSDA)

setwd('C:/Users/Erin/Documents/DataViz/Crops/')

key <- 'your api key here'
Get a variable of all possible commodities listed in the USDA site.
commodity <- tidyUSDA::allCommodity
Now we’ll loop through each commodity and check if there’s county level data for it. Additionally, we’ll filter down to just the data that’s expressed as a number of acres. I’m doing it this way because I didn’t feel like researching which commodities had “acres harvested” data available and which didn’t. This ain’t pretty and it ain’t fast, but it works.
all <- NULL

for (yr in 2000:2021) {
  for (i in 1:length(commodity)) {
    possibleError <- tryCatch(
      data <- getQuickstat(
        commodity = commodity[i],
        geographic_level = 'COUNTY',
        domain='TOTAL',
        year = as.character(yr),
        key = key,
        geometry = F,
        lower48 = F),
      error=function(e) e
    )

    if(!inherits(possibleError, "error")){
      data <- subset(data, unit_desc == 'HEAD' & !is.na(Value) & nchar(county_ansi) > 0) %>%
        transmute(GEOID = paste0(state_ansi, county_ansi), head = Value, year, desc = short_desc, type = statisticcat_desc)
      all <- bind_rows(all, data)
    }
  }
}

write.csv(all, "crops.csv", row.names = F)
And there you go, a big ol’ csv file with crops in it. Handy!
On the colors
Picking colors for a 14-class choropleth is a nightmare. (And again, I can hear my editor saying to either make it a bar chart or choose just 3-4 classes. But that’s lame and boring.)
I took a bit of a shortcut by harvesting colors I liked from geologic maps, which are both pretty and extremely colorful.
In the future, I’d like to take my initial palettes and run them through Matt Ström’s super interesting optimization algorithm to hopefully gain something a bit more readable and color-blind friendly.


Discover more from Data Stuff
Subscribe to get the latest posts sent to your email.
I learned something- I live in the pistachio belt. Cool!
Sent from the all new AOL app for iOS
[…] viz wiz Erin has a bunch of excellent new maps of crop distributions in the USA over on her website. The data come from USDA Quick Stats, but her maps are way cooler. This, for […]
[…] Continuing my investigation of the USDA Quickstats site I first used here… […]
Potatoes?
Also, one grows hay where one can’t grow anything (and i mean *anything*) else.
[…] Here’s a neat data project showing the most common crop by acreage for every county in the United States. The overall winner is—hay! Of course, there is a lot of variation, with the Corn Belt having the most acres in corn (big surprise!), South Georgia in cotton, and eastern North Carolina in sorghum. There are also maps broken down by fruit, vegetables, and nuts. Check it out at https://erdavis.com/2022/06/07/whats-the-most-common-crop-in-the-us/. […]
[…] Here […]