And now for something completely different!
I’m kidding, it’s more maps.
I’ve been wanting to make a map of the polar regions for a while–it’s a fun perspective that you don’t see very often (and everyone loves a good circle!)–but I didn’t have a dataset that would lend itself well to being mapped that way.
Luckily, wrecksite.eu popped up on Reddit a couple weeks ago, and I happily paid $35 to get the locations of 180,000+ wrecks across the world.
There’s a long and sad history of shipwrecks in polar regions, so this dataset matched perfectly with my desire to make some polar maps.
Add in Daniel Huffman’s excellent shaded relief tutorial to make some 3D terrain, and you get a good–though deeply sad–weekend mapping project.
Let’s Get Mapping
I sourced my data for this project from a number of places.
- Shipwrecks: wrecksite.eu
- Topography: ArcticDEM
- Sea ice extent: NSIDC
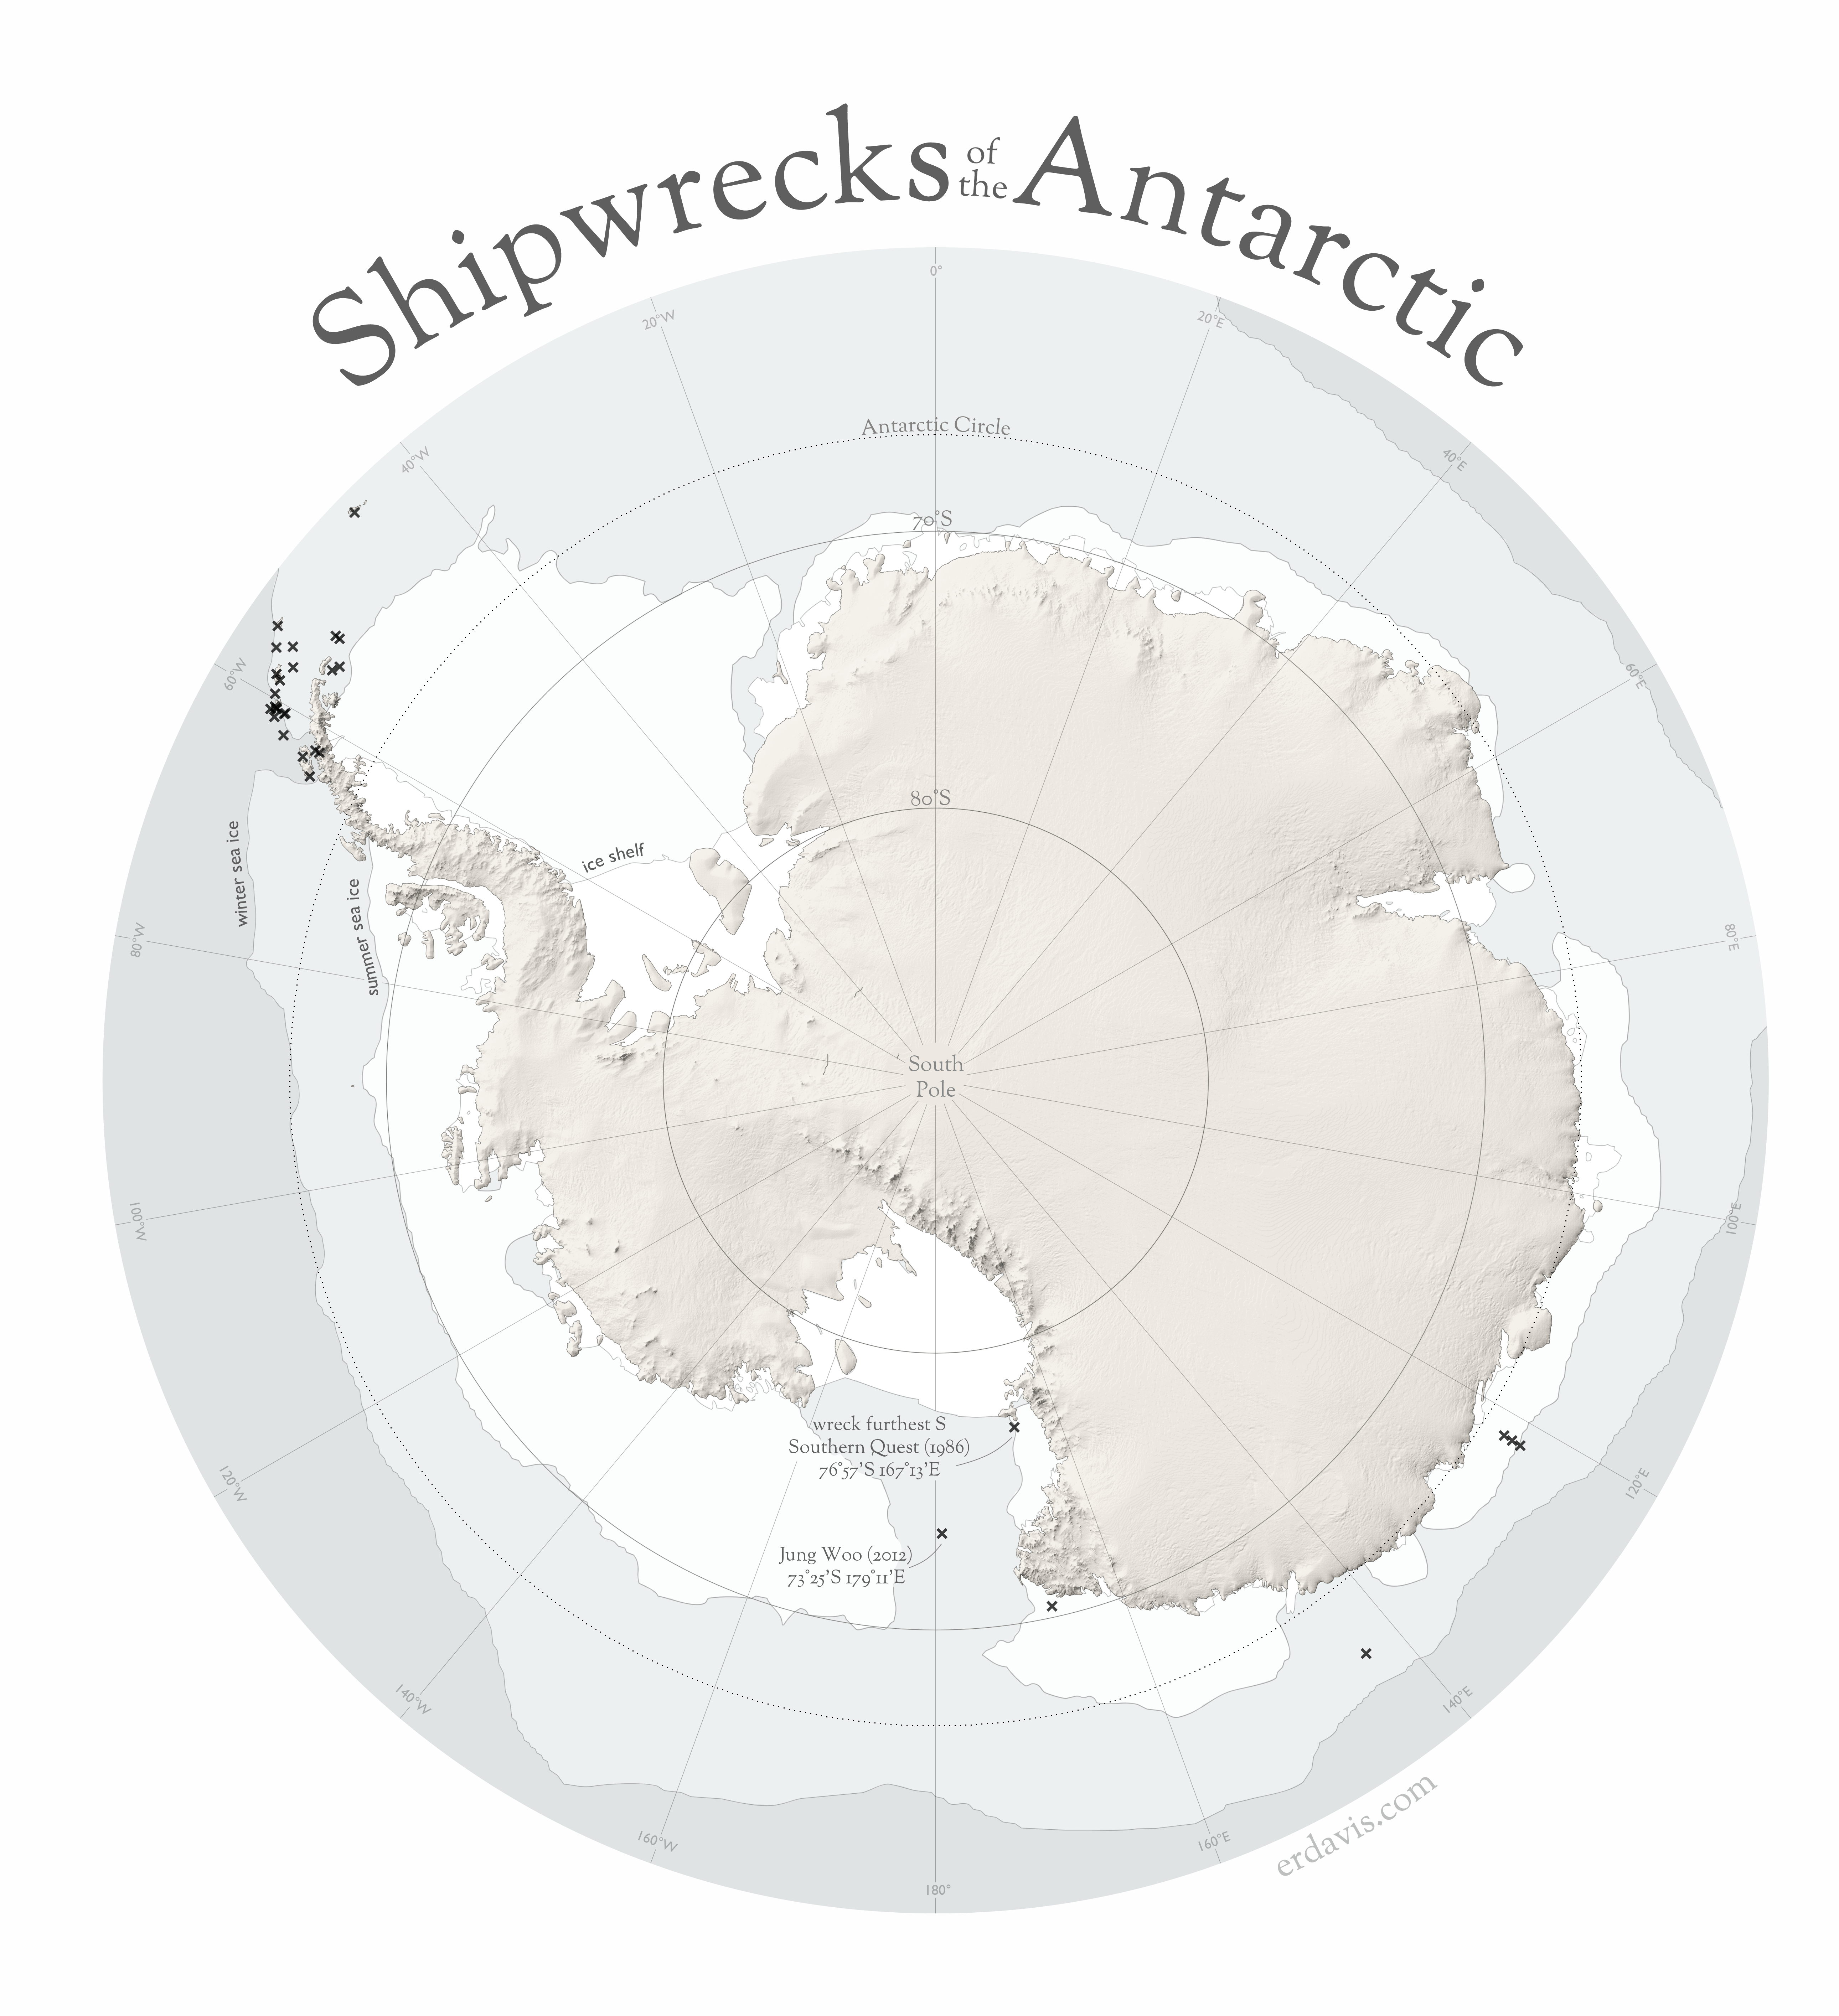
- Ice shelves (for Antarctica): Berkeley Geodata
Once I got everything downloaded and cleaned up, I aligned all my layers using QGIS. From QGIS, I exported nicely aligned PNGs which I then prettified and labelled in Photoshop.
Advancing from choropleths made in R to a real, grown-up GIS software feels like I’m making progress in amateur cartography. I never expected to like making maps so much, and I also never realized how much work those nice, National Geographic-style maps really are.
I hope my efforts won’t be judged against Nat Geo, though, but as an amateur excited to try out new techniques!
Some Self-Critique
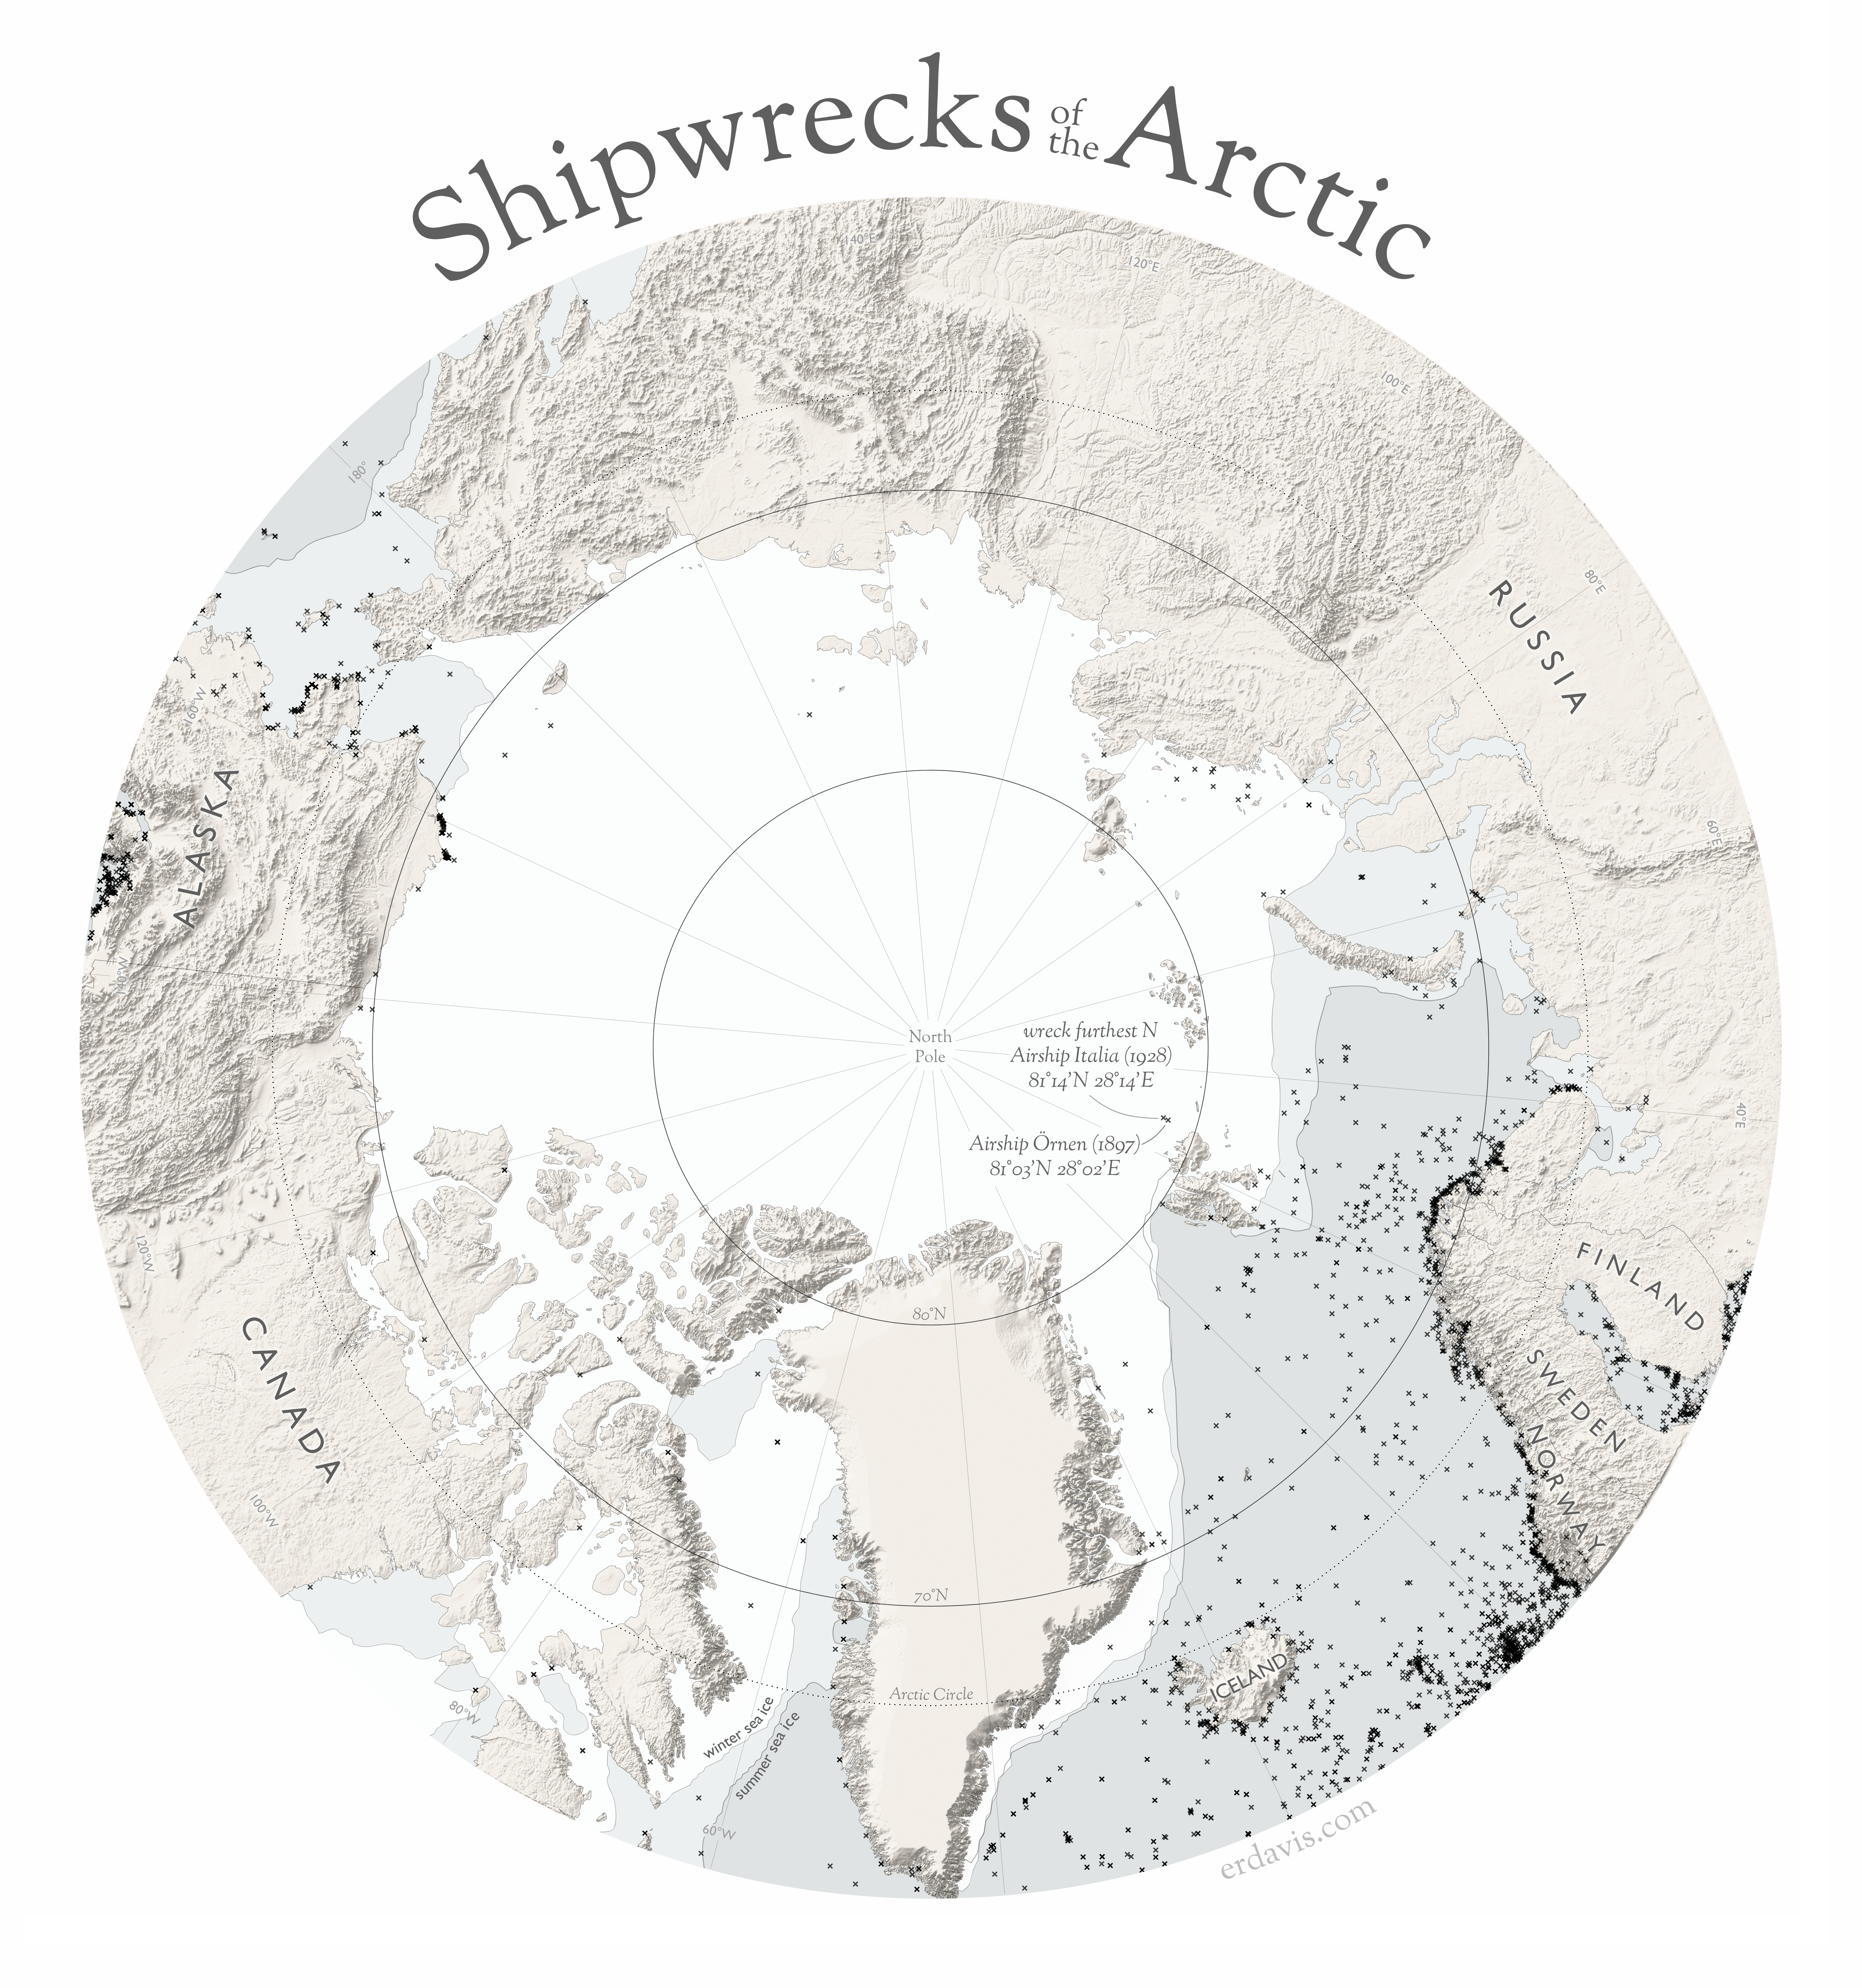
I’m really pleased with the aesthetics of these maps, but I do think I failed in my primary mission: to show shipwrecks, especially those of historical interest, in the Arctic.
I got too caught up in the excitement of 3D terrain rendering and ended up with maps that are fun to look at, but don’t really provide a ton of analytical information. The Arctic one in particular suffers from too much busy detail and not enough data.
If I were to do this again, I might consider omitting the fancy frills and going for a more stripped-down approach. I’d highlight wrecks of historical interest, perhaps via color or symbols (though I could make that change to the maps as they stand). It’d also be interesting to color wrecks by year to see if there’s been any pole-ward trends as the icecaps have melted.
I am pleased with my decision to add in ice extent contours, though, as they add a ton of much-needed context. The muted color palette also reminds me of the sun-bleached Nat Geo maps I had on my wall as a kid*.
For a weekend project, though, I’m ultimately OK with what I produced, especially when I view it as a learning experiment.
*Side rant: I’ve always loved maps, even as a kid. I had a faded map of Spain and Portugal above my bed for years. In a unit on geography, my 5th grade teacher asked the class to name a peninsula. I triumphantly shouted out, “the Iberian Peninsula!”
My teacher looked at me and scoffed, “that’s not a peninsula.”
Well, I’m back, 20 years later, to state that it most definitely is a peninsula, and she maybe shouldn’t have been teaching geography.
Discover more from Data Stuff
Subscribe to get the latest posts sent to your email.
[…] scientist Erin was inspired by the history of shipwrecks in polar regions of our planet and made these magnificent […]
Awesome! I appreciated your honest self-critic and ability to reflect improvements without harshness.
Cheers
Yep! That teacher had no business teaching geography. I’m another map lover (and a guy in his early 70s), but also a longtime lover (and user) of charts -particularly aeronautical. I flew for US Navy for 30 years, and spent countless hours pouring over charts – mostly in flight preparation, but also often to just enjoy the visual representation of geography. Thanks for sharing your work! Bill
Hi Erin, This is a really great visualization. Incidentally, I am working on a paper relating to the legal status of shipwrecks in the Arctic. I was inspired by your image and subscribed to wrecksite.eu. Unfortunately, I can’t make heads or tails of the site. Would it be possible for you to explain in greater detail how you managed to download the positions of the wrecksites in the Arctic? I am trying to better understand the types of wrecks that are in the Arctic and their historical importance. Thank you so much for your help. Emily
Hey, glad you liked it!
To get a list of Arctic shipwrecks, I went to wrecks > search wrecks (on the main page), then clicked the 5th button in advanced options (search geographically).
From there, chose geography > in a rectangle, and filtered with min long = -180, max long = 180, max lat = 90, min lat = 60. You can also add in a date wrecked search if you want wrecks from a certain era.
They don’t provide an export function, which is a bummer. If there’s not too many results it’s not a problem to just copy+paste the results into Excel. You can also web scrape the results using a tool like Selenium, if you’re comfortable with a bit of programming.
This was a search I tried, I think the link should work:
https://wrecksite.eu/wreck-search.aspx?text#&&aj=qrveXow%2fBA4GsVb6c7rkDNozBPLUSwvMLIvYQYctYAFPh99QTyWd3iVeElVvsYKqTPLUS0vkYEPVlfo3BohapePLUSO3MXZViVjt1nhMEcY3rQbi4fxVc0RQodULqvt852bBgoKpY
This was exactly the help I needed, thank you so much! Keep up the amazing work on this website and I can’t wait to see what other maps you create!
[…] was an early (terrible) attempt at terrain rendering. I ended up leaving this project and doing Shipwrecks of the Arctic […]